Policy Papers
How Ontario’s Mid-Sized Cities Can Thrive: A Toolkit for Economic Development
This paper examines an “regeneration toolkit” for an economic development strategy regarding mid-sized cities, and applies it’s lessons to four Ontario cities that have experienced the economic and social consequences of de-industrialization in recent decades.
Edited by Sean Speer
Issue Statement
Even before the pandemic, there was growing recognition of place-based differences with respect to economic growth, investment and jobs across Ontario. As the 2019 Fall Economic Statement observed:
“There are some areas of the province that have not fully recovered from the global economic downturn over a decade ago. In order for Ontario to be a global leader in job growth and the premier destination to start a new business, all regions of the province should share in prosperity.”[1]
The government’s recognition of these geographical disparities was followed by a communique from the Council of the Federation (comprising the country’s provincial and territorial premiers) in December 2019 which committed to “taking the necessary steps to address regional disparities across the country.”[2]
The source of these growing place-based economic disparities is two-fold:
- The trend towards urban agglomeration and the growing concentration of investment and jobs in so-called “superstar cities,” which are pulling away from the rest of the country (or within provinces), according to the key metrics generally associated with growth and dynamism such as access to venture capital and patent registrations; and
- The ongoing process of de-industrialization – specifically the transition from a goods-producing economy to a service-based economy – which has disproportionately affected rural and regional communities that were previously dependent on manufacturing- and resource-based industries for employment and opportunity.
This paper is primarily focused on the latter issue. It outlines a framework – what we call a “regeneration toolkit” – to inform economic development strategies in Ontario communities struggling with the negative investment and employment effects of de-industrialization. The goal is to arm provincial and local policymakers with an evidence-based toolkit for developing customized economic development strategies for rural and economically-distressed communities.
The analysis builds on recent work by the UK-based consultancy, Public First, to develop such an economic development strategy for the City of Windsor, which has been significantly affected by these trends of technological dislocation, offshoring, and economic stagnation. The city lost a total of 11,900 automotive manufacturing jobs between 2001 and 2013, and automotive manufacturing declined from representing 1 in 5 full time jobs in 2001 to 1 in 8 by 2013.[3]
The “regeneration toolkit” used to inform an economic development strategy for Windsor can have broader application to other Ontario communities that have had similar experiences of trade- and technology-induced dislocation. The toolkit enables provincial and local policymakers to understand the drivers of investment and job growth, to assess a community’s strengths and weaknesses relative to these factors for growth, and to then develop specific policies that accentuate its strengths and mitigates its weaknesses.
This paper applies the toolkit to four Ontario cities that, like Windsor, have experienced the economic and social consequences of de-industrialization in recent decades. These four cities – Oshawa, Peterborough, Sudbury, and Thunder Bay – were selected because, while they are different in terms of their economic profile, geography, and history, they share similar long-run challenges, broadly a common model of municipal governance, and are eligible for the same types of provincial and federal supports.
The key takeaways for Ontario policymakers are:
- Any city, irrespective of size or location, can benefit from policies tied to clear economic growth strategies, however there is no single model. Each city must develop and adopt its own plan. The policy or civic initiative that works for Sudbury would not necessarily work for Oshawa, and what is more urgently needed in Peterborough might be less of a near-term priority for Windsor.
- Municipalities will necessarily need local mayoral and council leadership with the vision and appetite to embrace a new strategy. Every municipality will require its own bespoke support and the strategies that are developed may need external scrutiny and validation. This will require political consensus around a certain degree of risk.
- Although necessary, this local political consensus alone is insufficient, because smaller cities may simply lack the resources to conceive a coherent strategy alongside their pressing daily administrative duties, or have the bandwidth to develop the plan needed to implement it by themselves. Some provincial funding support in such cases would be warranted.
- In order to successfully diversify their economies and adapt to new market realities, cities need strategies that leverage the contribution that higher levels of government can make. Unlike many US cities, Canadian municipalities simply lack the financial autonomy or legal powers to do this on their own, even if there is political consensus locally. To successfully devise and pursue a bespoke economic development strategy, cities like Peterborough, Sudbury and Oshawa need partners, both locally, and externally, to support them.
- Top-down strategies are not effective unless they are developed collaboratively, and where the willing municipality is exploiting a local asset or historic strength for the city, for example, Windsor’s emphasis on automobility as a development of its historic auto-industry manufacturing strength.
- There are relevant policy agendas for the future development of regional cities that are outside the remit of even the provincial governments. The most important of these is the federal remit around immigration, which is Canada-wide (except Quebec). All the cities in this study are already impacted by Canada’s high rates of immigration but there will be opportunities for them to benefit more from inward migration of talented newcomers if the incentives can be aligned so that policies encourage migrants to settle in the communities outside Toronto.
- The policy agenda that is more squarely in the remit of municipal government is a city’s business attraction focus. In the context of new working patterns post-pandemic, the ability of a city to diversify by supporting local start-ups and enticing entrepreneurs to relocate will be important.
- Fundamentally, the success or otherwise of city revitalisation efforts is dependent on all types of people – community leaders, businesses, local residents, visitors – changing their behaviour and choosing an area. So, strategies need to be built around policies that are likely to effect behaviour change.
Decision Context
Previous Ontario 360 analysis has shown the extent to which economic activity, investment and employment have been concentrated in a small number of major Ontario cities over the past decade.[4] One example: of the 865,000 net new jobs created in the province from January 2008 to August 2019, 88 percent were in Toronto and Ottawa.
There are two main factors contributing to these growing regional economic disparities in the province. The first is the broader trend of urban agglomeration in which investment and jobs are increasingly concentrating in major cities – what are sometimes described as “superstar cities” – across advanced economies.[5] There are various causes for urban agglomeration but the most significant may be the powerful network effects of the knowledge-based economy and the cumulative benefits that come from the close proximity of capital, talent and ideas.[6]
The second factor behind growing regional disparities is the ongoing process of de-industrialization – specifically the transition from a goods-producing economy to a service-based economy – that has disproportionately affected rural and regional communities previously dependent on manufacturing- and resource-based industries.[7] A significant decline in manufacturing employment, in particular, has been a major source of dislocation and stagnation in various mid-sized cities across the province which had previously relied on the sector as the foundation of middle- class jobs and opportunity outside of Ontario’s major cities.[8]
This process of de-industrialization is hardly unique to Ontario. It reflects a broader trend across advanced economies that has been driven by a combination of technology-enabled productivity and trade-enabled outsourcing.[9] Traditional sources of middle-class employment and – particularly in mid-size and peripheral communities – have been in secular decline.
As a result, the notion of so-called “left behind” cities has increasingly become a key part of political economy discussions – especially in light of the significant socio-cultural and political consequences associated with economic stagnation and joblessness. Research on the “deaths of despair” in de-industrialized parts of the United States and the rise of political populism point to the effects of de-industrialization as a factor behind these major socio-cultural and political developments.
The upshot: there is renewed interest in addressing regional economic disparities and catalysing greater investment and employment in rural and economically- distressed places. An example of such placed-based policymaking, which Ontario 360 has previously analysed, is the Opportunity Zones model launched in the United States in recent years to try to pull capital into small geographic areas that underperform on key economic metrics.[10]
Although this model may have potential as a tool for encouraging investment in rural and economically-distressed communities, it is important to recognize that there are no silver bullets. The market forces pushing capital, ideas, and talent to major centres are powerful. No single policy is going to reverse urban agglomeration or revitalize economically-distressed places on its own. It is going to require a mix of different policies to try to catalyse jobs, growth, and opportunities across the province.
It is also important to recognize that the success or failure of different policies is highly context-dependent and can be influenced by a community’s economic environment or how a given policy is implemented. Impact evaluations are difficult to carry out given the significant number of confounding variables, and even more difficult to apply from one place to another given different historical and present factors which invariably influence results. Trial and error and a degree of humility are therefore useful ingredients for any economic development strategy.
The evidence does indicate, however, that, when used carefully and adapted for the local context, there are various policies that can indeed help cities prosper. Our research – included in the report prepared for the City of Windsor in 2021[11] – identifies four explanations, in particular, that are associated with better placed- based economic outcomes:
- Sectors and clusters: Many modern cities have prospered by cultivating an economic specialism and maintaining competitive advantages in a given industry or sub-sector. Think of Silicon Valley for information technology, Hollywood for films, or Detroit for cars. However, if/when that industry declines, the city must either shift to a new specialism, diversify across several industries, or suffer long- term decline.
- People: One way that cities can grow is by becoming attractive places for highly talented and creative people to live and work. The theory is that a critical mass of such people will create businesses and jobs that help support the rest of the local economy. Some strategies for attracting highly talented people include hosting high-quality universities, creating attractive streetscapes and green spaces, or cultivating cultural and sporting amenities.
- Agglomeration: The empirical evidence overwhelmingly suggests that cities enjoy economies of scale: the larger they are, the greater their productivity levels. Smaller cities can also realize the effects of agglomeration by linking with other surrounding cities to allow businesses and workers to make more connections and achieve economies of scale.
- Competitiveness: Cities must compete with each other for talented workers and productive businesses. Cities can increase their competitiveness through investing in infrastructure, setting competitive tax rates, and supporting research and innovation.
There remains a significant debate in the literature over which of these factors is most important, how they interact with one another, and the precise role for public policy to help cultivate them. But most scholars agree that these are four broad areas that policymakers ought to focus on in developing place-based development strategies.
Decision Considerations
Our “regeneration toolkit” aims to highlight the role of public policy within these four areas. In particular, it sets out how different policies across a wide range of issues – including higher education and transit – can contribute to the broad goals of (1) clusters, (2) people, (3) agglomeration, and (4) competitiveness. The toolkit draws on the academic literature to identify eleven specific areas that should inform and shape place-based economic development strategies. This part of the paper outlines these eleven areas and the underlying evidence behind them.
1. Sectors and clusters
Target particular sectors or clusters
There is longstanding debate among academics and policymakers as to whether governments should pick and choose so-called “winners’’ by targeting policy support to specific sectors or clusters as opposed to designing neutral, economy-wide policies.
For example, should a government provide R&D tax credits to firms within a sector it hopes to boost (e.g., aerospace or manufacturing), or design such R&D tax credits for any firm regardless of its sector? The choice between implementing targeted versus so-called “non-discriminate policies” ultimately comes down to different political economy considerations. Targeted, sector-specific policies may help to achieve a degree of industrial specialization, whereas non-discriminate policies may lead to fewer distortions and to a more diverse economy.
Both specialism and diversification approaches may have merit depending on a city’s specific economic context and political economy goals. Cities may, on one hand, seek to diversify their economies to reduce their reliance on any single sector and in turn reduce their vulnerability to potential shocks. On the other hand, specialising in a specific sector can lead to increased knowledge spillovers and localisation advantages.[12]
Although the academic literature around targeting particular sectors and clusters has found it to be generally ineffective, it remains a popular tool amongst policymakers and has generated renewed interest in the context of COVID-19 and concerns about supply chain resiliency.[13] Therefore, it is important for policymakers to understand how and when this strategy can be useful and effective for achieving certain goals.
The most successful examples of cities targeting particular sectors or clusters have typically pursued a bottom-up, rather than top-down approach. These governments have not chosen a sector or industry and attempted to impose it on the economy, but rather have built on organic developments in their own markets. The role of public policy has been to accentuate these pre-existing strengths as opposed to trying to cultivate new sectors from scratch.
Pittsburgh, for example, which was once dominated by the steel industry, now has an economy built on advanced manufacturing, technology and health care, driven by the city’s pre-existing strength in research and development. This shift started when world-leading universities began producing high quality graduates, thus attracting private sector firms to take advantage of the localised human capital. The city accelerated this shift by investing heavily in R&D – the region’s per capita spending on R&D was 2.5x the national average in 2016.[14]
Support innovation
Empirical evidence suggests that cities can benefit from public investments in innovation, for example, through R&D grants, subsidised loans for R&D activities, tax credits, and policies that encourage collaboration and supply chain development.
Public investments in innovation can benefit an economy in two main ways: first, they can generate private returns by helping firms find more efficient ways to develop and deliver their products; and second, they can generate social returns through spillover effects.[15]
These spillover effects are the basis for public investments in innovation – the cost of innovation can outweigh an individual firm’s private returns, however, when combined with the social returns, the benefits outweigh the costs, making investment attractive to a government but possibly not an individual firm.[16]
There are various reasons, however, why governments may choose not to invest heavily in innovation. First, the returns to investments in innovation are often long-term and non-linear, which makes it difficult to determine a casual relationship between public spending and outcomes such as economic growth or increased levels of productivity.[17] This time horizon gap can also create political economy disincentives whereby the politicians who enact the investments are no longer in office when the benefits of those investments are realized, and therefore it may not be perceived as in their own political interests to prioritise investments in innovation.
Second, there have been concerns that public sector investments in innovation can crowd out private investment, essentially subsidising private investment with public funds.[18] The question of incrementality is highly important in trying to gauge the utility of these public investments. Ontario’s Auditor General observed in 2015, for instance, that the provincial government was “unable to conclude on whether its economic development and employment-support programs are effective in ensuring sustainable benefits.”[19]
The What Works Centre for Local Economic Growth in the United Kingdom analysed 42 impact evaluations of R&D grants, loans and subsidies across different jurisdictions to better understand the impact of government investments in innovation. The authors found that, in roughly half of the program evaluations, there were positive effects on the outcomes measured, including the level of the recipient firm’s R&D expenditure, innovation (patents or product innovation), and economic outcomes (employment, productivity or firm performance). This suggests that government interventions aimed at boosting innovation can be generally effective.[20]
Utilize Retail-Led Regeneration
For many economies around the world, the retail sector is a significant employer and contributor to economic output.[21] In Ontario, for example, the retail sector is the province’s second largest industry, accounting for 11.3 percent of total employment and 4.93 percent of the province’s GDP.[22] Similarly, in the UK, the retail sector makes up 9.3 percent of total employment and 5.2 percent of the UK’s total economic output.[23]
Yet, over the past few decades, many countries have faced a decline of the traditional retail sector and of town centres, as small retailers have been replaced by large, often multinational corporations that can outcompete smaller firms in prices and profits by taking advantage of economies of scale and increasingly web-based models.[24]
In response, many governments have attempted retail-led regeneration programs (sometimes described as “Main Street” programs and policies) in an effort to revitalise town centres and support the rejuvenation of the traditional retail sector. The government can incentivise growth in the retail sector through targeted grants, tax relief or simplified planning procedures. The research on retail-led regeneration programs is still nascent[25] though the evidence that is available shows ambiguous results.[26]
One study looking at the impact of several retail-led regeneration projects found that these projects do often improve local employment outcomes. However, there is debate around whether it is just a case of job displacement, whereby the new job opportunities are essentially offset by others disappearing. This can occur if existing firms simply move locations to take advantage of government incentives in another part of the city (this would lead to no net change in local employment levels), or if the introduction of new firms into the area pushes other businesses out of the market.[27]
2. People
Improve cultural infrastructure
New cultural amenities, such as sports facilities, museums, concert halls, and non-profit art businesses can make cities more attractive to tourists, skilled foreign workers and investors by improving a city’s image and contributing to economic activity.[28] However, there is little evidence to suggest that flagship projects alone are sufficient for economic regeneration. Instead, this strategy is most likely to be effective when public support for organic ‘cultural clusters’ is part of a broader economic regeneration program.
Cultural amenities can be used to engage residents and provide a sense of identity and community in a neighbourhood. Research into the impact of the emergence of “cultural clusters” – concentrations of art, music, history and other cultural amenities – has found that they are associated with higher levels of civic engagement, increasing populations, rising housing values, and decreasing rates of poverty.[29] Many places which have experienced successful regeneration efforts, such as the Old City in Philadelphia and Bilbao, Spain, placed the creative and cultural sector at the core of their economic revival strategies.
On the other hand, research suggests that cultural megaprojects, such as large sports facilities or grand museums, are often not good value for money. A 2016 meta analysis found that introducing major sporting and cultural events and facilities has negligible and often zero measurable impact on the region’s economy.[30] The expectations for these projects are commonly inflated in the planning stage and, in reality, they often require ongoing operating subsidies and fail to deliver the expected economic boost to the city.[31]
The challenge for policymakers, therefore, is to identify emerging pockets of cultural clusters and provide targeted support to help them grow. Strategic interventions within emerging clusters, such as restoring historic buildings, funding public art displays, and offering grants and subsidies for creative/cultural sector businesses, are likely to be more effective and profitable than attempting to manufacture a cultural sector through large scale investment in a megaproject. Research suggests that once a cultural cluster forms, investment in the area can have significant spillover effects on other parts of the city.[32]
Revitalize brownfields and urban spaces
Many post-industrial cities have vacant properties that were once used for commercial or industrial purposes but have since been abandoned. These properties are known as brownfields and are often contaminated with hazardous materials, making them unattractive to developers and negatively impacting property values in the surrounding area.
Policymakers often include brownfield revitalisation in city regeneration plans in an attempt to attract investment to these areas and boost productivity by transforming vacant buildings into usable space. Research shows that brownfield regeneration is often effective at increasing surrounding property prices, however, the links to long term improvement in productivity or employment are unclear.
As with most strategies, empirical research suggests that cleaning up and revitalising a brownfield property is not enough alone to stimulate local economic regeneration. Instead, this strategy is most effective when it is part of a wider community regeneration plan, which considers how to integrate the redeveloped property into the existing community.[33]
The impact of brownfield revitalisation is also dependent on the purpose of the redeveloped property – whether it is intended for commercial, residential, or recreational use. When brownfield properties are redeveloped into commercial or industrial space they are, perhaps unsurprisingly, more likely to create more long- term employment opportunities and have larger impacts on the local economy than other types of development.[34] On the other hand, the employment impact of redevelopments for residential or recreational use, such as housing developments or public parks, are more likely to be short term construction jobs, with very few long- term employment opportunities.
However, transforming brownfield sites into residential or recreational spaces may have other benefits, such as increasing local property values and quality of life for residents by improving the quality of the local housing stock, the streetscape and access to green spaces.[35] There may also be spillover effects into the wider economic performance as property values rise and higher-income residents move into the neighbourhood.[36] It is difficult in practice though to measure these wider economic outcomes and attribute them directly to the regeneration project. Overall, the empirical evidence suggests these revitalisation projects do generally increase property values, however, they have negligible and often non-existent wider economic impacts, such as employment or income levels.[37]
Invest in higher education
Investing in higher education institutions can have several beneficial impacts on a city’s economy – both by increasing the education level and productivity of the workforce, but also through spillover effects from an institution’s research efforts, which can benefit local companies and industries.[38] However, investing in higher education may not have a significant impact if the city has a low graduate retention rate and highly skilled workers leave the city after graduating to find work elsewhere. Therefore, the challenge for policymakers is to ensure that quality higher education institutions exist and, importantly, that there are local opportunities for graduates afterward.[39]
As with most strategies, investment in higher education is most effective when policymakers provide support to a specific niche or pre-established specialism rather than attempting to manufacture a new specialism or sector from scratch. Further, this strategy works best as part of an integrated approach aimed at supporting the growth of a specific sector within a city. For example, a city with a long history of auto manufacturing may benefit from providing both research grants to universities and subsidies to businesses that focus on advanced manufacturing or engineering.
Some research has found multiplier effects on the wider economy as a result of investment in higher education, both in terms of output and employment. These impacts are particularly robust throughout the university supply chain, specifically manufacturing, wholesale and retail trade, and business activities. An impact evaluation of universities on the UK economy, for instance, found that for every 100 full-time jobs within universities, a further 117 full-time-equivalent jobs were generated across the economy. Further, for every £1 million of university output, a further £1.35 million of output was generated across other sectors of the economy.[40]
The impact of higher education institutions may also differ depending on the area that the institution specialises in – with empirical evidence suggesting that universities that specialise in basic science, applied science and engineering are more likely to contribute to new firm growth in the local area relative to those that specialise in social sciences or the humanities.[41] Researchers have found, for example, that firms, particularly in the pharmaceutical industry, often locate their R&D activities near quality universities.[42], [43]
3. Agglomeration
Invest in transport links
Investments in transport links can attract businesses, improve quality of life for residents and commuters, and connect cities to people and businesses in surrounding areas. Empirical evidence suggests that investment in transportation infrastructure is most impactful when it is used to ease identified constraints, such as a growing population, high levels of congestion and rising property prices. Transportation projects are most effective when they are used to unlock an identified choke point, regardless of the size of the project. In fact, there is substantial evidence of major projects turning into white elephants or ‘roads to nowhere’, which do not provide good value for money.
One prominent rationale for investment in transportation is that it can reduce transport costs for both businesses and commuters. This can be savings in terms of time – by reducing congestion or creating faster transport options (i.e., replacing buses with a rail system) – or actual monetary savings through reducing fares. This can be important when a city is experiencing increased congestion due to a growing population. Therefore, this theory suggests that cities should make decisions around investment in transportation based on population and economic growth rates, as this will likely be correlated with increased transport demand.[44]
However, the counterargument is that this exacerbates inequality by targeting investment in areas which are already experiencing growth. In the UK, for example, a 2013 report found that the government’s infrastructure spending amounted to approximately £2,700 per person in London and the Southeast compared to £5 per person in the Northeast. In other words, per capita infrastructure spending was 500 times higher in London than it was in the Northeast.[45]
The second prominent rationale is that investment in infrastructure itself can be a driver of growth by connecting cities to surrounding people, firms and places, generating agglomeration effects of increased productivity and investment.[46] However, a meta analysis by the What Works Centre for Local Economic Growth found mixed evidence regarding the impact of transport projects on economic measures, such as employment, productivity, income levels and firm entry.[47]
Overall, the evidence suggests that transport projects can reduce costs for businesses and commuters and can generate agglomeration effects by connecting cities to outside places, however, success is highly context-specific.[48] Therefore, policymakers should be cautious when investing in transport projects and should ensure the project addresses identified local constraints.
Encourage businesses to relocate with enterprise and special economic zones
Cities can attract businesses and start-ups by offering tax or regulatory relief within specific geographic areas, often known as enterprise zones or special economic zones. Evidence suggests that in many cases, special economic zones can be effective at attracting new business growth to a city, however, the impact of these zones is highly context specific. This strategy can be ineffective if it incentivises existing businesses in the area to relocate rather than driving new growth.[49]
Further, special economic zones seem to be most effective when they are introduced in areas with pre-existing geographic advantages, such as near other agglomerations or at trading crossroads. Overall, though, the evidence provides an underwhelming case for these types of place-based incentives for several reasons.
First, with regards to driving new business growth, some evidence suggests that special economic zones are more effective at redistributing economic activity within cities rather than across cities. This is because businesses consider many other outside factors related to the wider economic landscape when relocating, including, for example, the productivity of the local workforce, access to suppliers, labour or land costs, and quality of life.[50] The incentives offered in special economic zones may not outweigh the other costs associated with locating within a certain area. Therefore, tax and regulatory relief through special economic zones will certainly be attractive to existing businesses located in other parts of the city, but potentially not sufficient for attracting businesses operating outside of the city.[51]
Second, empirical evidence suggests that special economic zones tend to create few net new jobs.[52] If introducing special economic zones simply causes businesses to relocate from one area of a city to another, then it will have no impact on the city’s employment levels. On the other hand, if the policy does attract new businesses to the area, it may have a positive impact on local employment. However, this is highly dependent on the characteristics of the local workforce – if the local workforce lacks the skills required by the new businesses then the jobs are likely to be taken by commuters and, again, the policy will have no impact on the city’s local employment levels.[53] Overall, impact evaluations of enterprise zones both in the US and UK find that where there are employment gains, they come at an extremely high price.[54]
Therefore, when considering implementing special economic zones, it is important for policymakers to build on local geographic and economic advantages and attract new businesses that complement the skills of the local workforce.
Encourage high-skilled immigration
Attracting high skilled immigrants has been a key priority for several ‘Rust Belt’ communities in the U.S. High skilled immigrants can help reverse trends of declining populations and raise a city’s human capital, boosting the productivity and income levels of the workforce. They are also disproportionately likely to become entrepreneurs, creating local businesses and jobs.[55] In Detroit, immigrants make up 8 percent of the population, but 17 percent of business owners and in Baltimore, immigrants represent 9 percent of the population but 21 percent of entrepreneurs. Across the US, immigrant owned small businesses employ 4.7 million people and generate $776 billion in income.[56]
Many post-industrial regions have experienced decades of declining industries and populations, which has led to fewer employment opportunities, smaller tax bases for local governments and decreased consumer spending. Combined, these factors have contributed to the region’s shrinking economy and declining prosperity. High skilled immigration in the ‘Rust Belt’ in recent years, however, has helped to combat many of these problems. Between 2000 and 2015, immigrants accounted for half of regional population growth and offset population decline in around a third of the top metro areas in the region.[57]
Further, high skilled immigrants have disproportionately filled high level positions in healthcare and manufacturing, helping to keep the industries in the region. For example, foreign-born workers make up one out of every seven manufacturing engineers, and one out of every four of the region’s physicians and surgeons. This is despite immigrants only representing 7.3 percent of the region’s population.[58]
The positive impact of high skilled immigration in the US has been corroborated by research findings in the UK. One study found that between 2001 and 2011, immigrants had a net positive fiscal contribution to public finances of £25 billion, indicating that overall, immigrants contributed more to the nation’s finances (for example through taxes) than they received (for example through welfare benefits). Further, their research concluded that immigrants had, on average, higher levels of education compared to natives – in 2011, 35 percent of EEA immigrants and 41 percent of non-EEA immigrants had a degree, compared to 24 percent of native UK residents.[59]
Overall, the evidence overwhelmingly suggests that cities with declining populations and shrinking industries can benefit from an influx of highly skilled and highly educated immigrants. Policymakers should therefore consider how they can attract high skilled immigrants, specifically in target industries, through attractive immigration policies, for example, by providing subsidised visas and other placed-based preferences.
4. Competitiveness
Provide access to finance
Small and medium-sized enterprises (SMEs) are an important driver of economic growth, however, access to finance remains a consistent restraint to growth, limiting the ability of SMEs to contribute to the overall economy.[60] Structural market failures, such as imperfect or asymmetric information, can affect both the level of debt and equity finance to SMEs, leading to potentially viable businesses being impeded by a lack of access to capital. In fact, when compared to other obstacles to growth (e.g. corruption, political instability), access to finance is found to be the most constraining factor for SMEs.[61] Therefore, governments can provide access to finance and other forms of business support targeted towards SMEs to help them overcome these barriers and correct these market failures.
SMEs and start-ups tend to have uncertain future profitability, which makes them risky investments for lenders. As a result, lenders reduce the supply of finance below what the market actually demands, and many small firms therefore struggle to find lenders that will work with them. Many SMEs and start-ups face information market failures – some entrepreneurs and business owners may not fully understand the benefits of raising finance and therefore may not apply, or may not know where to look for finance in the first place.[62]
During economic recessions or downturns, lenders become even more risk averse and the struggle for SMEs to access finance increases. As such, SMEs are among the most vulnerable during periods of economic decline. Therefore, this is particularly relevant to many post-industrial cities with a history of poor economic performance – SMEs and start-ups in these cities face significant barriers to finance due to the wider declining economic landscape they operate within.
There are several policy initiatives governments can introduce to improve access to finance and other support to SMEs, including: providing information, providing incentives to lenders (for example, tax breaks for lenders who loan to SMEs), indirectly providing finance to SMEs (for example, loan guarantees), or directly providing finance to SMEs.
A 2016 meta analysis found that, generally, policies aimed at improving access to finance are successful at improving the availability of credit and the cost of borrowing for SMEs. The study also looked at the wider impact of access to finance on firm performance, and found that, in the majority of cases, access to finance led to at least one positive firm outcome (such as firm survival, employment, wages, sales and profit).[63] This suggests that improving access to finance can be a powerful tool for governments, particularly in cities experiencing economic decline.
Support training and employment
Many post-industrial cities face high levels of unemployment as traditional industries leave the region and a skills mismatch emerges between the labour market and the remaining employment opportunities. Training programs can be an important tool for policymakers in combatting unemployment and ensuring the workforce has the necessary skills to transition to new industries and attract new businesses to the area. However, training programs are not always successful;[64] they work best when there are high levels of collaboration between the private sector, public sector and post-secondary institutions, and generally occur in cities that are not entirely cut off from new tradable industries.
Although some training programs are delivered nationally in attempts to “upskill” the workforce on a larger scale, there is considerable evidence that training programs created and implemented at the community level are more effective. A 2017 study analysing the impact of training programs across three U.S. cities found that “micro-skill ecosystems” – local networks of secondary schools, key employers, and community members – are more effective at meeting the needs of local employers than a national system.[65] Other research has corroborated the importance of getting key agencies to work together in delivering successful training programs, emphasising the importance that local stakeholders agree on objectives and outputs.[66]
Further, a program’s success may also be dependent on where the training takes place, either on the job or within a classroom setting. A 2016 meta analysis found that on the job training programs tend to outperform classroom-based programs.[67] This may be because on the job training gives individuals a better idea of what to expect in their day-to-day responsibilities, reducing the likelihood that they will be disappointed or dislike the job and leave after they start. On the job training also provides more targeted, specific forms of training that may better prepare trainees for the job than a classroom-based approach.
One of the most important factors that influences the success of skills-training programs is whether a city has access to new employment opportunities either within the city itself or within commuting distance. A retraining program in Birmingham, for example, was able to place 90 percent of individuals who lost their job in an automobile plant closure into new employment opportunities within three years.[68] In the case of Janesville, however, a retraining program for individuals who lost their jobs in an automobile plant closure was found to have no impact on increasing graduates’ chances of employment.[69] One explanation for this difference in outcomes is that individuals in Birmingham benefit from agglomeration, and have better access to new industries and jobs both within Birmingham or in the surrounding areas. For those in Janesville, on the other hand, many employment opportunities only existed in cities and towns that were several hours away.
What the Toolkit Means for Policymakers
There is significant debate over which of these approaches is most important, and which drives the others. Do highly productive cities have high incomes from successful local industries which they can spend on improving amenities – or can investing in amenities in the first place attract new start-ups to the city? Is it better to specialise in a single industry where you can be a world leader, or does this leave you especially vulnerable to economic shocks? The truth is, there is no single cure for cities with declining economies. Cities are extremely variable and complex, operating within everchanging internal and external contexts – the regeneration strategies that work in one city may well fail in another.
The key for city leaders and policymakers is therefore to identify the unique bottlenecks in their economies and look for the policy solutions to address them – are there many start-ups that are struggling to take off? Are there emerging sectors that could benefit from targeted support? Do the skills of the labour force match those required by employers? This will require collecting and making sense of the economic data policymakers have at their disposal, but also having a firm grasp on public opinion – what do residents and businesses think about the housing, employment opportunities, and cultural amenities in the city?
Although the work of regenerating cities is complex and context-specific, the toolkit provides a lens through which policymakers can explore their city’s unique challenges and opportunities. Further, the evidence suggests there are a few general rules for policymakers to keep in mind:
- Major downstream investments, such as housing or sports stadiums, that are built on the assumption of population growth are less likely to be successful than policies that support developing economic strengths and broader competitiveness. There are very few examples of cities building new stadiums or museums that themselves change a city’s trajectory.
- When a city, or a particular area of the city, is at full capacity then new transport infrastructure or housing investments can help unlock growth. Investment in struggling neighbourhoods near a more successful neighbor is likely a highly effective strategy.
- It is unlikely that policymakers will be able to force a city to become a world leader in a completely new sector from the top-down. However, policymakers can do a lot to help organically emerging sectors to scale up.
- Incentives for companies, such as tax breaks and grants, may encourage them to move to a particular city over a nearby competitor, but are rarely enough on their own and the long-term effectiveness of these strategies is unclear – when the incentives go, the company sometimes goes too.
- Innovation is becoming an increasingly important avenue for growth for cities in advanced economies. These cities foster ideas and support the growth of a workforce with advanced skills – including by attracting high skilled workers from elsewhere. These strengths can be in manufacturing, but the higher up the value chain you go, the better protected the city is.
- Cultural amenities may not be sufficient for economic regeneration on their own, but they may be necessary. Increasingly, cities are competing with each other on the attractions they offer and it’s not a surprise that high skilled professionals want to live near museums, concert halls, well maintained parks and art galleries.
Applying the Toolkit
To illustrate how the regeneration toolkit might help to inform provincial and local policymaking, we have tested its application with four Ontario cities that are at different stages of de-industrialization and regeneration. This test application is not comprehensive – a proper application would involve, for instance, local engagement with policymakers, stakeholders, and citizens. The goal here is to analyse these communities using the toolkit and to show how it could be used to ultimately develop customised economic development strategies for each of them.
In addition to the City of Windsor (which was the subject of the initial analysis using the toolkit), the communities that we selected – Oshawa, Peterborough, Sudbury, and Thunder Bay – are based on their economic histories. All are or were major centres of Canada’s traditional industries, such as grain transport, mining, manufacturing, and forestry, and have since shifted the basis of their economic activity and employment due to the ongoing process of de-industrialization. The transition to a service-based economy has created significant dislocation and contributed to job losses, economic stagnation, and other socio-economic consequences.
The following analysis shows how these different cities have performed in comparison to the province as a whole across a range of key economic and social metrics. Annexes for each community provide a snapshot of their histories and a brief forecast of their potential futures if current trends and trajectories hold.
In choosing these cities, special thought was given to the role played by Oshawa (represented by the Oshawa Census Metropolitan Area, which includes the suburban communities of Whitby and Clarington along with the City of Oshawa). As will become clear from the summary statistics below, Oshawa represents a city that has started down a path towards economic regeneration and transformation, already in the midst of transition away from its traditional role as simply an automotive manufacturing hub. By comparison, the other cities in this analysis, especially Peterborough, Thunder Bay, and Sudbury, face common challenges such as aging populations, shrinking workforces and weak recoveries from the 2008 recession.
Population
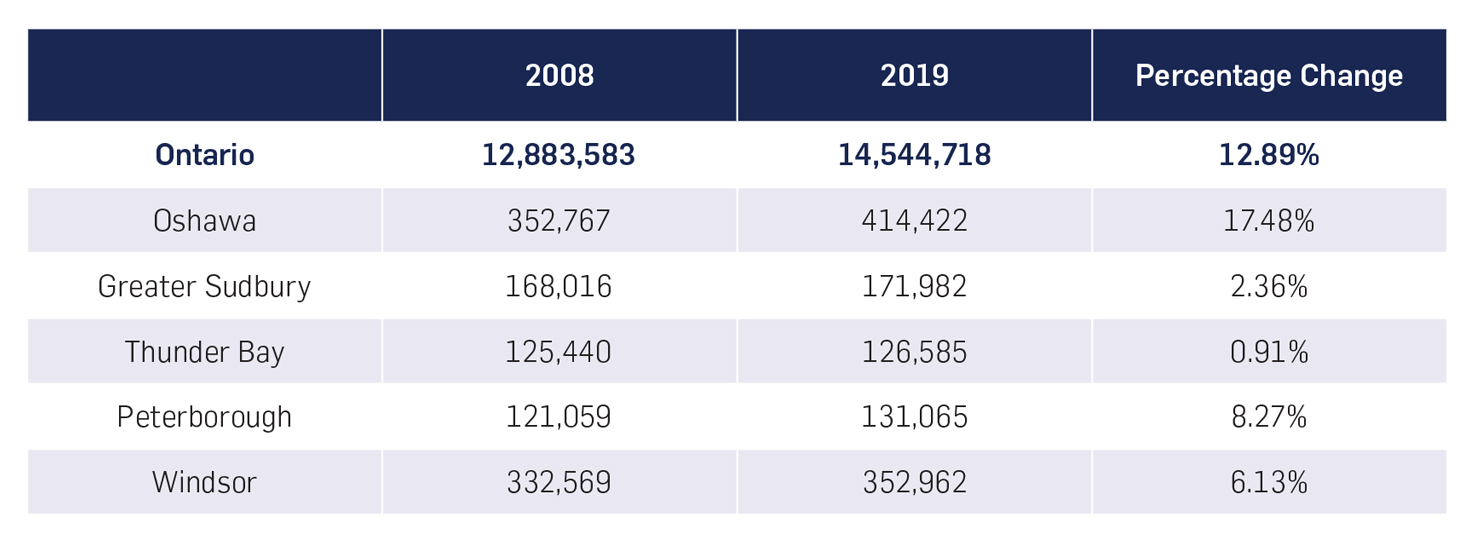
Of the four cities, population growth was highest in Oshawa between 2008 and 2019. The city grew by 17.5 percent between 2008 and 2019. Peterborough’s population grew by 8.3 percent, Windsor’s grew by 6.1 percent.
Greater Sudbury and Thunder Bay grew far more slowly, with totals of 2.4 percent and 0.9 percent during this period, respectively.[70] Besides Oshawa, every city fell significantly below the Ontario-wide average in terms of population growth since the 2008-09 recession. Thunder Bay and Greater Sudbury barely grew at all over this period (see Figure 1).
Figure 1: Population Growth And Rate Of Change, 2008 To 2019[71]
Shifts in age demographics
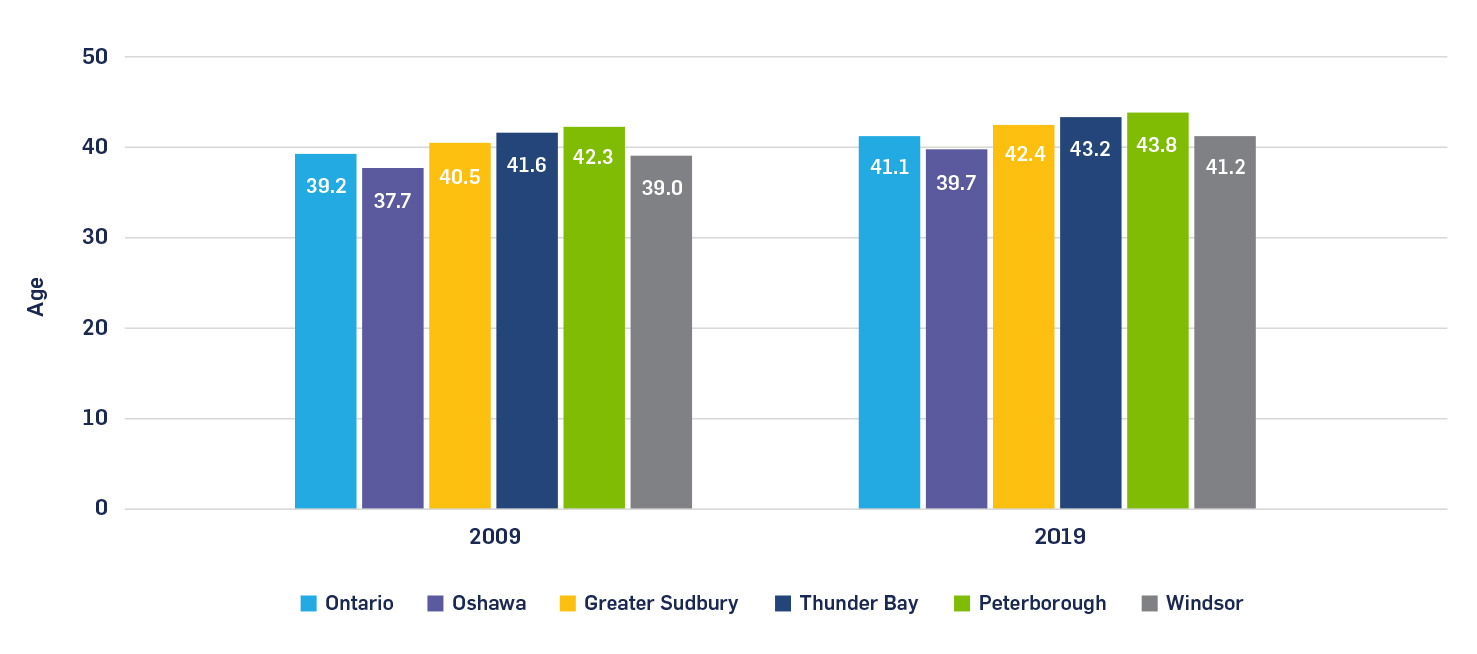
The average age in Ontario rose from 39.2 years to 41.1 years from 2009 to 2019. Of the target cities subjected to our analysis, three of them (Sudbury, Thunder Bay, and Peterborough) have older populations than the Ontario average.[72]
As the population of these cities has aged, their demographic pyramids have also shifted accordingly. In general, there has been a significant rise in the number of seniors in all five cities alongside a decline in the share of the population represented by working-age residents.[73]
Figure 2: Average Age, Ontario As A Whole And Target Cities, 2009 To 2019[74]
Immigration trends
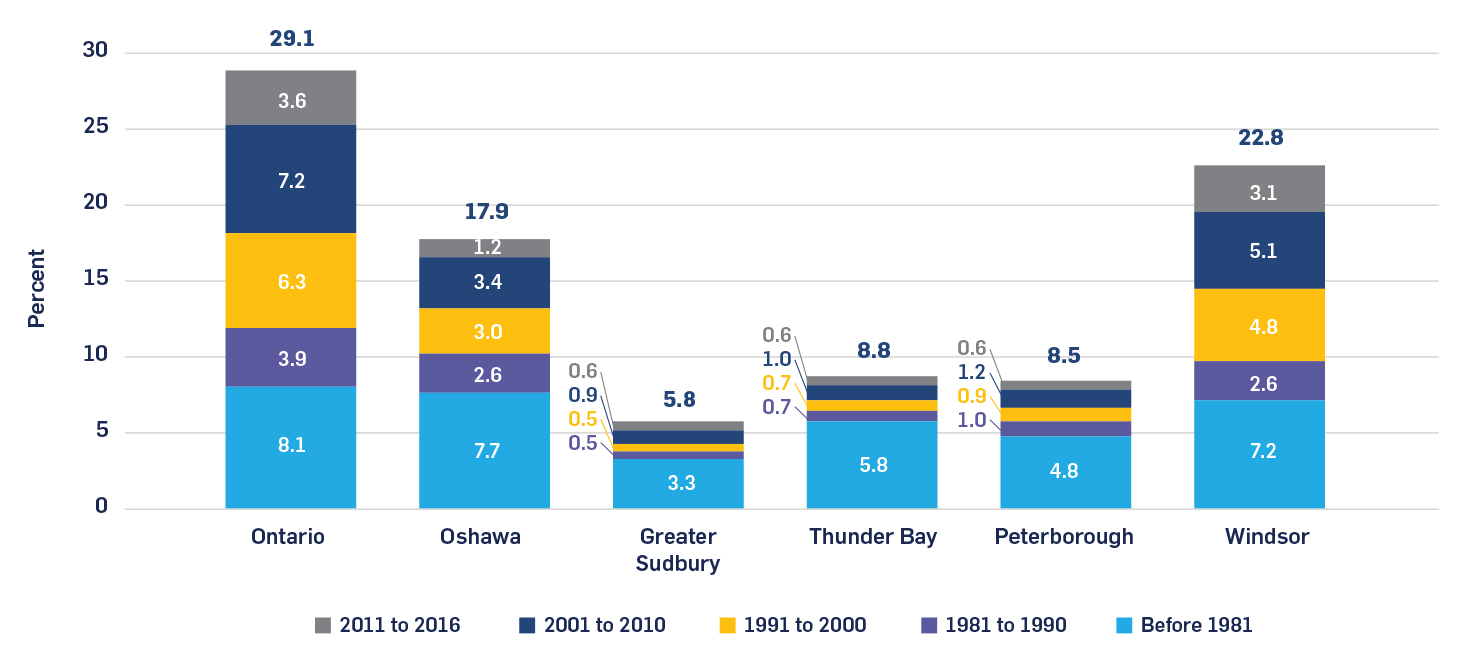
All five cities fell below the Ontario-wide average in terms of the percentage of their population that are immigrants, defined as foreign-born Canadian citizens and residents. In Greater Sudbury, Thunder Bay, and Peterborough, immigrants who arrived before 1981 comprise more than 50 percent of the total immigrant population, indicating that immigration flows to these places has slowed in recent decades.[75]
Figure 3: Immigrant Population By Period, Ontario As A Whole And Target Cities, 1981 To 2016[76]
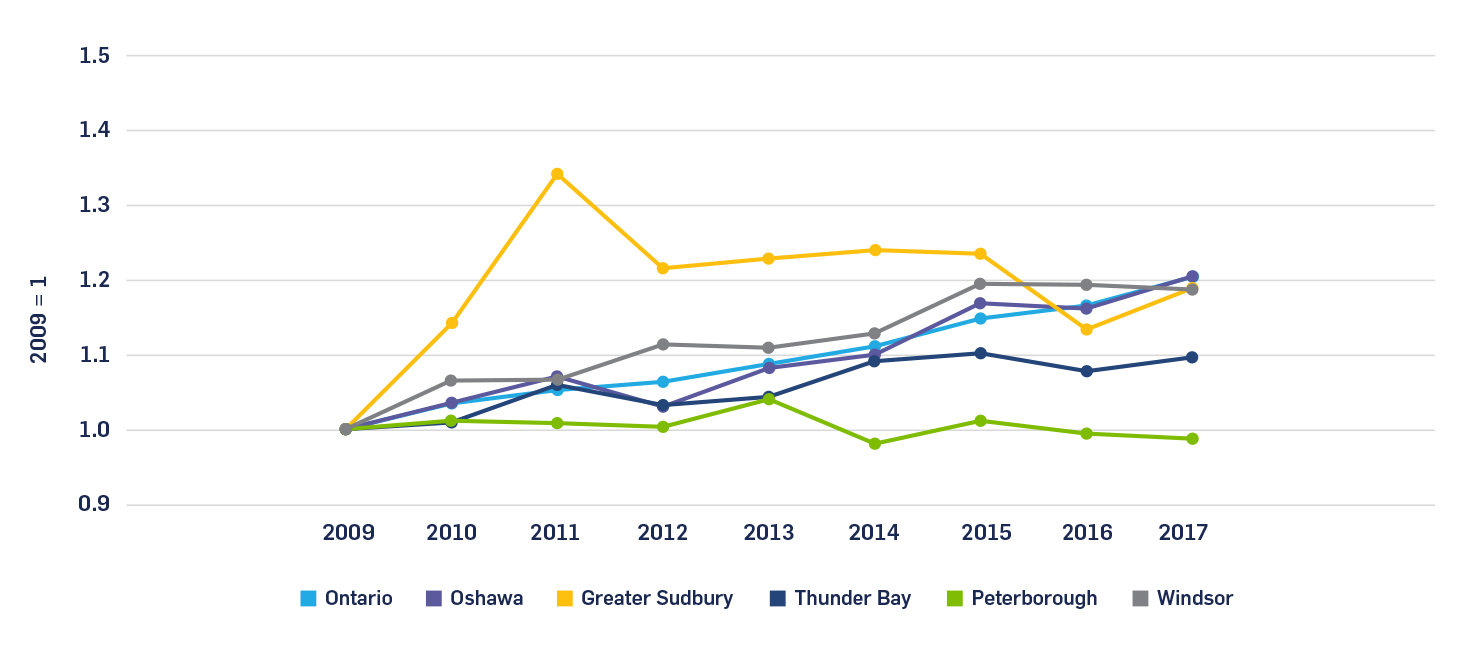
GDP growth
Compared to the provincial average, Windsor’s GDP growth surpassed the average for most of the period from 2009 to 2017. Oshawa’s growth closely tracked that of the province as a whole (see Figure 4).
Thunder Bay, by contrast, underperformed the provincial average and Peterborough actually experienced a negative growth rate during this period. The poor performance of these municipalities speaks to structural economic issues and the long-term impact of the great recession on their economies.
Greater Sudbury constitutes an outlier in this regard in that it tracked above and below the provincial average at various times over the timeframe. This may be explained by the fact that, as a hub for mining, Greater Sudbury’s GDP growth trajectory appears to closely track, especially, the fluctuations in copper prices over the same period.[77] More analysis on the influence of commodity prices on the city’s GDP is of course required before making such a casual connection.
Figure 4: Real GDP Growth, Ontario As A Whole And Target Cities ($2012 CAD), 2009 To 2017[78]
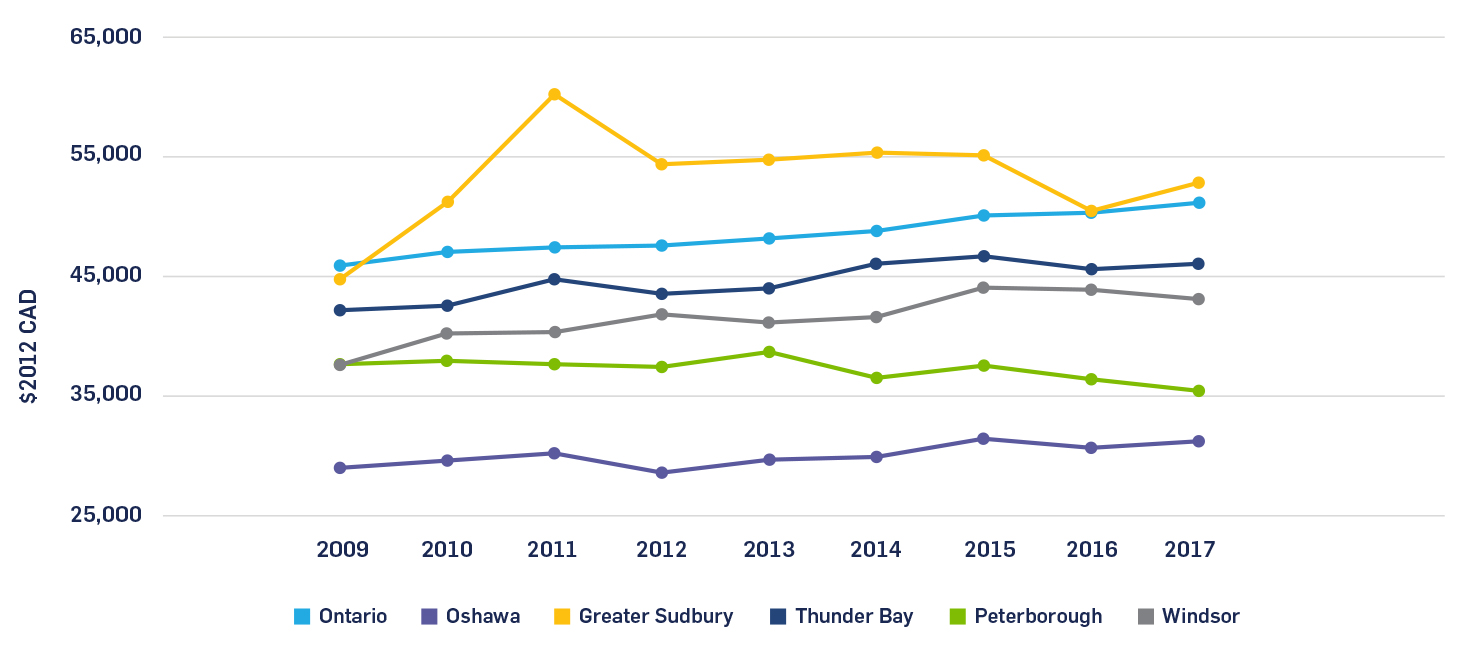
GDP per capita
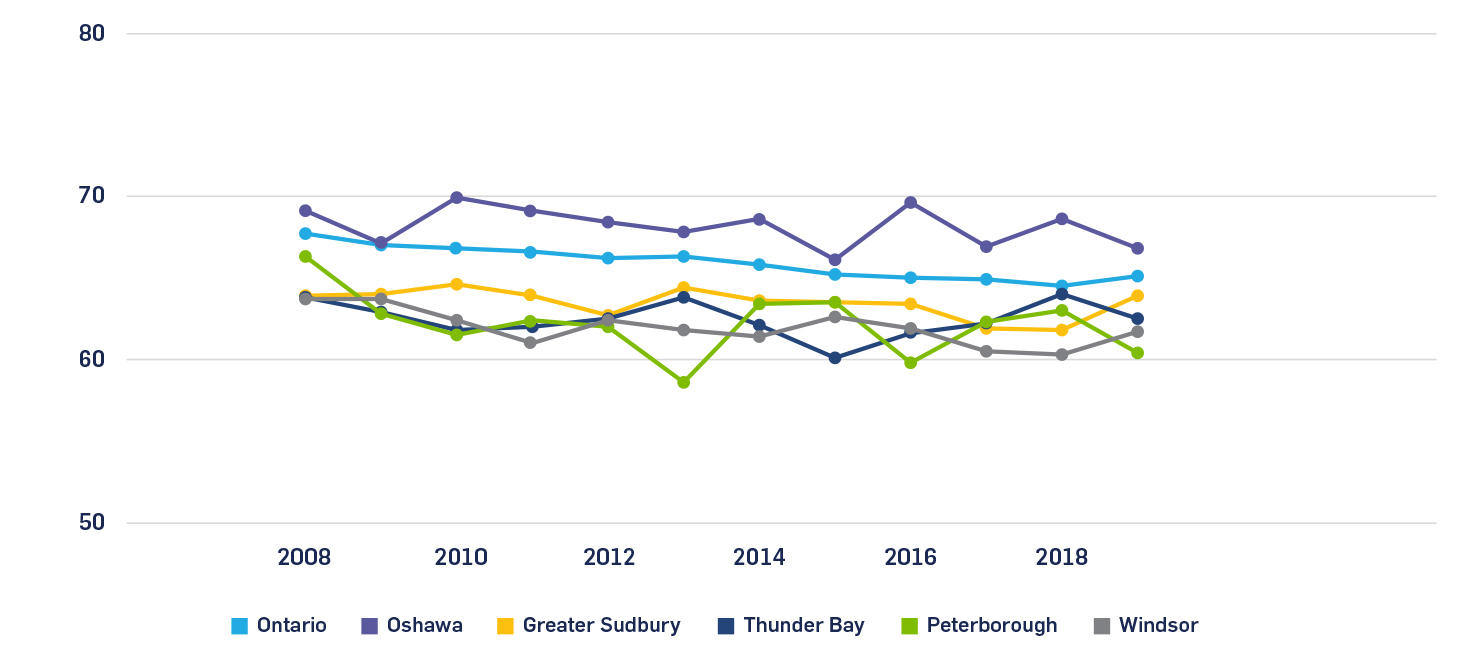
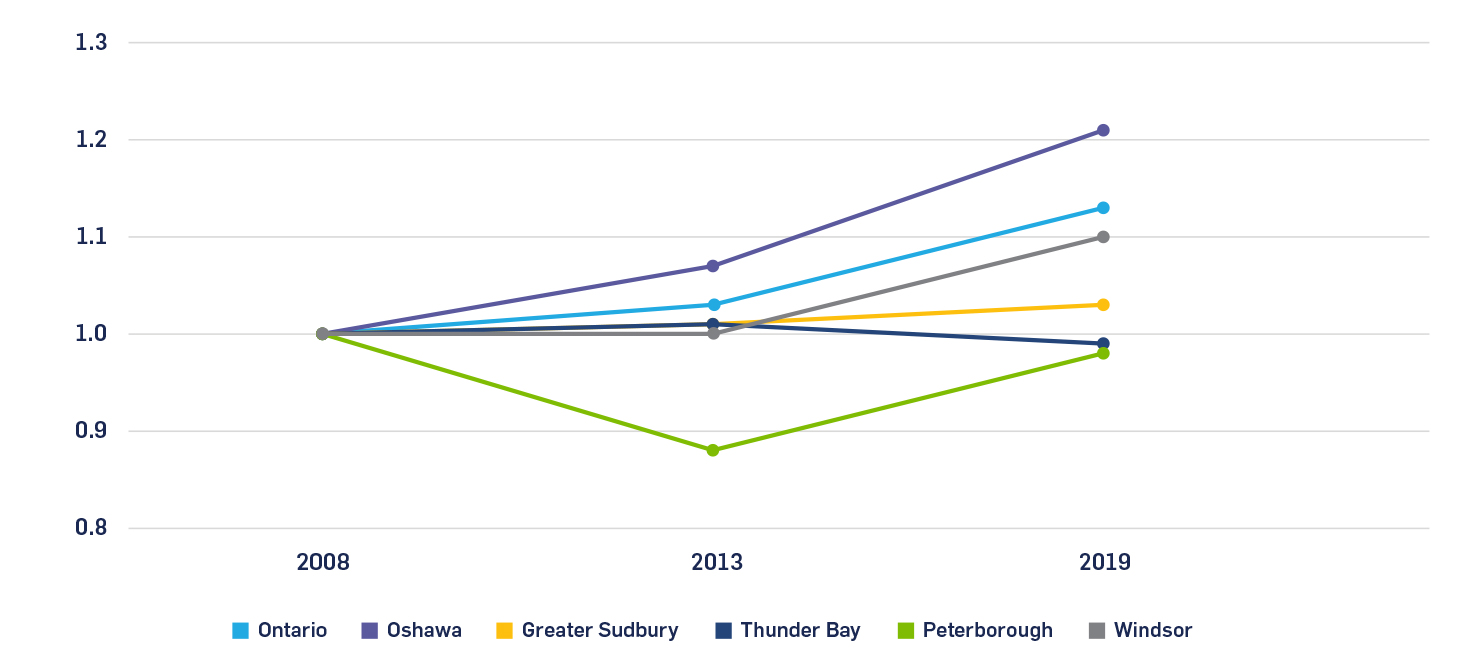
The GDP per capita picture provides more direct insight into living standards in these cities. Aside from Greater Sudbury, whose data may be influenced by the fluctuations in commodity prices, all cities have consistently maintained lower levels of GDP per capita than Ontario as a whole over the observed period. That can imply sustained weak labour productivity in these cities. The gap is lowest with Thunder Bay and Windsor and highest with Oshawa (see Figure 5).
Windsor and Peterborough’s levels of GDP per capita have notably diverged since the great recession. While Windsor has improved its position relative to the province-wide average, with its GDP per capita rising by almost 15% during since 2008-09, Peterborough’s has actually declined over the same period.
Figure 5: GDP Per Capita, Ontario As A Whole And Target Cities ($2012 CAD), 2009 To 2017[79]
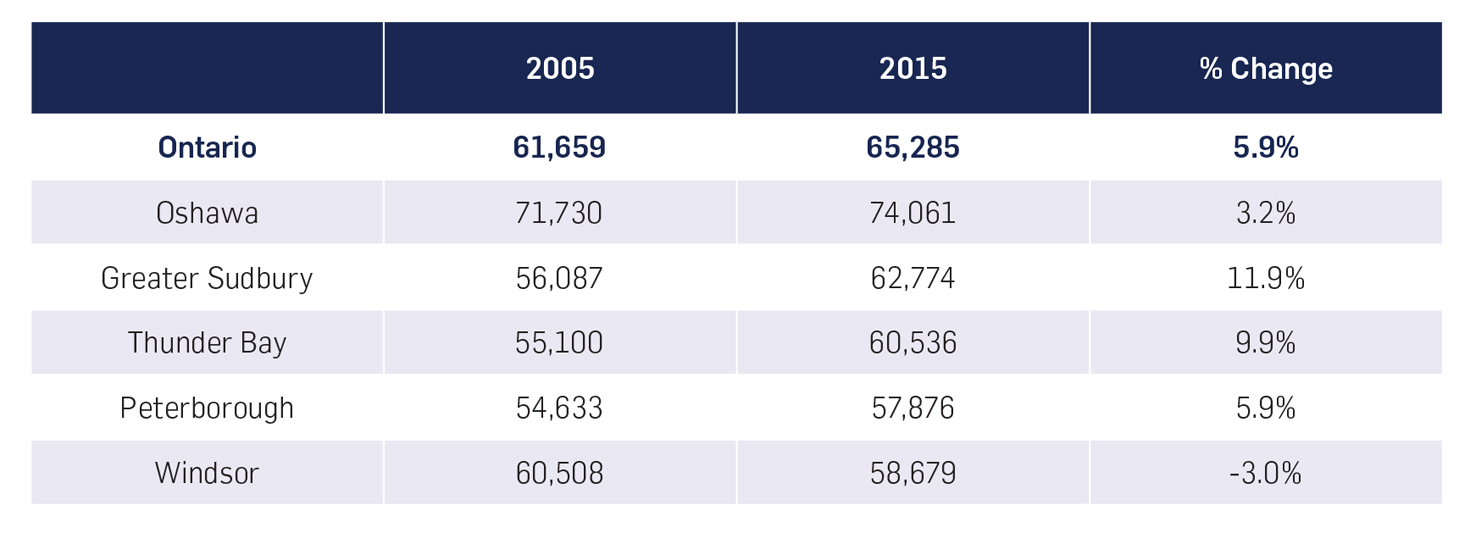
Median household income
Aside from Oshawa, which remains significantly above the Ontario median for household income between 2005 and 2015, Greater Sudbury, Thunder Bay, Peterborough and Windsor fell below the average for the province (see Figure 6).
However, both Sudbury and Thunder Bay grew significantly faster than the province as a whole. Windsor, by contrast, saw real median household income decline during this period, potentially reflecting the consequences of a manufacturing-driven recession given the city’s ongoing dependence on the sector, even by the standards of other industrial peer-group cities.
Figure 6: Median Household After-Tax Income, Ontario As A Whole And Target Cities ($2015 CAD), 2005 To 2015[80]
Unemployment and labour force participation
While maintaining unemployment rates near to the Ontario-wide average in 2019 (see Figure 7), Sudbury, Peterborough and Greater Sudbury have also experienced consistently lower labour force participation rates, a fact likely rooted in their older populations in comparison to both the province as a whole and Oshawa.
Windsor’s participation rate is comparatively low relative to the age of its population, but the city also sustained higher rates of unemployment than the Ontario average throughout the recession and afterwards, only briefly falling below it in 2016-2017. From 2008 to 2019, the level of decline in the labour force participation rate was highest in Peterborough, also the fastest-aging municipality.
Figure 7: Unemployment Rate, Ontario As A Whole And Target Cities, (Age 15 Years And Older), 2008 To 2019[81]
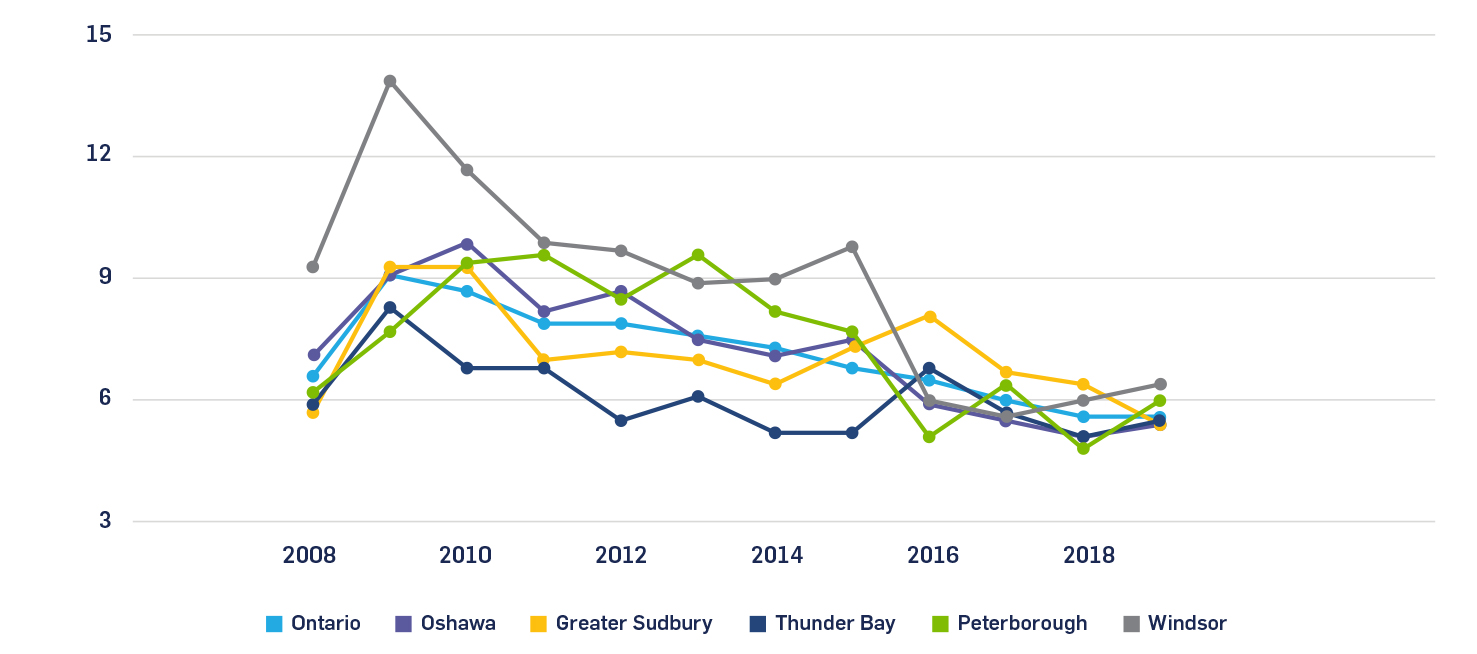 Figure 8: Participation Rate, Ontario As A Whole And Target Cities, (Age 15 Years And Older), 2008 To 2019[82]
 Labour force growth
From 2008 to 2019, Oshawa surpassed the Ontario-wide average for labour force growth while the other target cities fell below the provincial average. In fact, Thunder Bay and Peterborough’s labour forces did not recover to their pre-recession peaks (2008) by 2019, potentially speaking to the long-term impact of the recession on labour force growth in these cities (see Figure 9).
Figure 9: Labour Force Growth, Ontario As A Whole And Target Cities, 2008 To 2019[83]
Shifts in sector-based employment
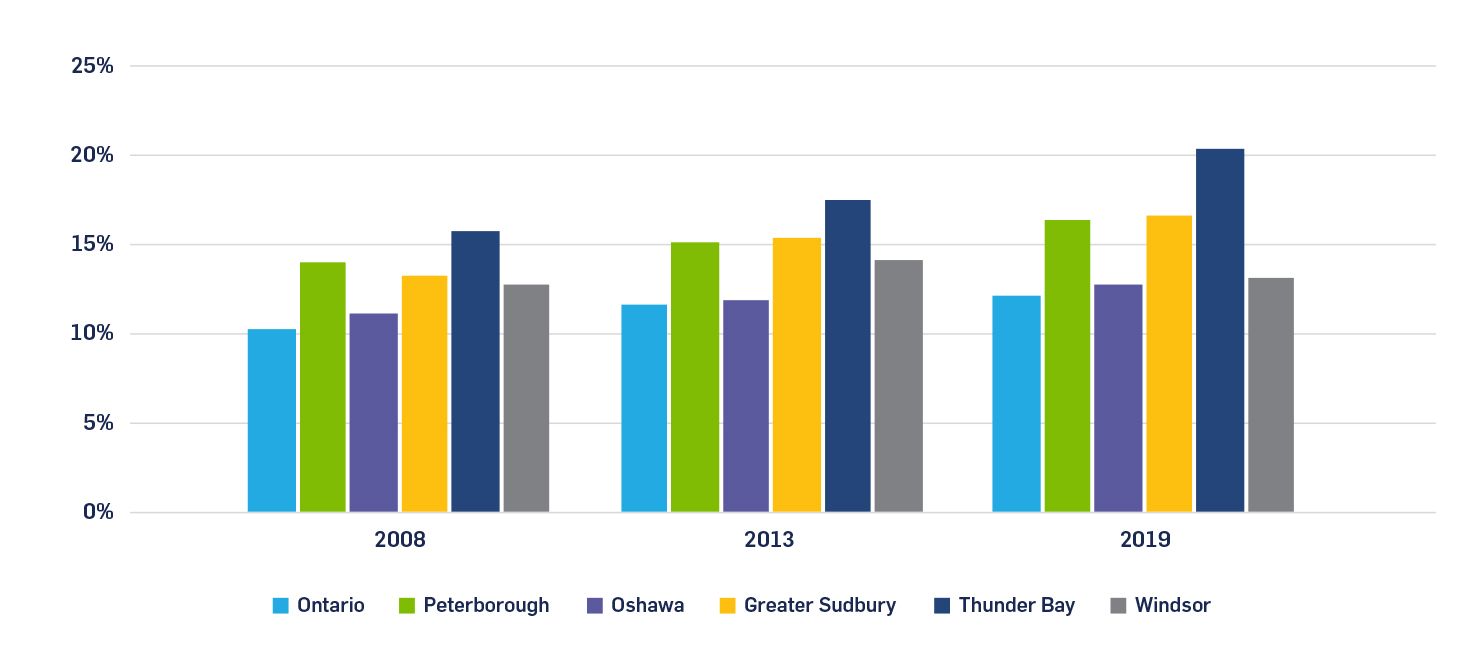
Across Ontario, the biggest labour market story since 2008 has been the continuing decline in the employment share of manufacturing in favor of retail trade, construction and health-care services, and other sectors (see Figure 10). This trend has tracked across the target cities though the pace and intensity has differed a bit to reflect unique local circumstances (see Figure 11).
In Peterborough, manufacturing employment declined in favour of construction and health-care services. In Oshawa, there was a similar story, alongside growth in the service sector. In Sudbury, mining’s importance made it a top-three industry that held a tenth of the workforce, but the growth of health-care services, construction and public administration has altered the city’s employment landscape.
In Thunder Bay, health-care services replaced wholesale and retail trade as the largest industry, with educational services third. In other words, the city’s long- standing industrial base has been fundamentally reshaped in the direction of a service-based economy.
In Windsor, manufacturing has retained its primacy as the city’s largest source of employment; in fact, although it had fallen to 20.3 percent in 2013, by 2019 manufacturing had increased, the only multi-year increase in employment in manufacturing among the cities surveyed.
The growth of health-care services closely tracked the growth of seniors as a percentage of the population, most closely in Sudbury and Thunder Bay. In the other target cities, health-care employment grew at more variable rates.
Figure 10: Manufacturing As Share Of Employment, Ontario As A Whole And Target Cities, 2009 To 2019[84]
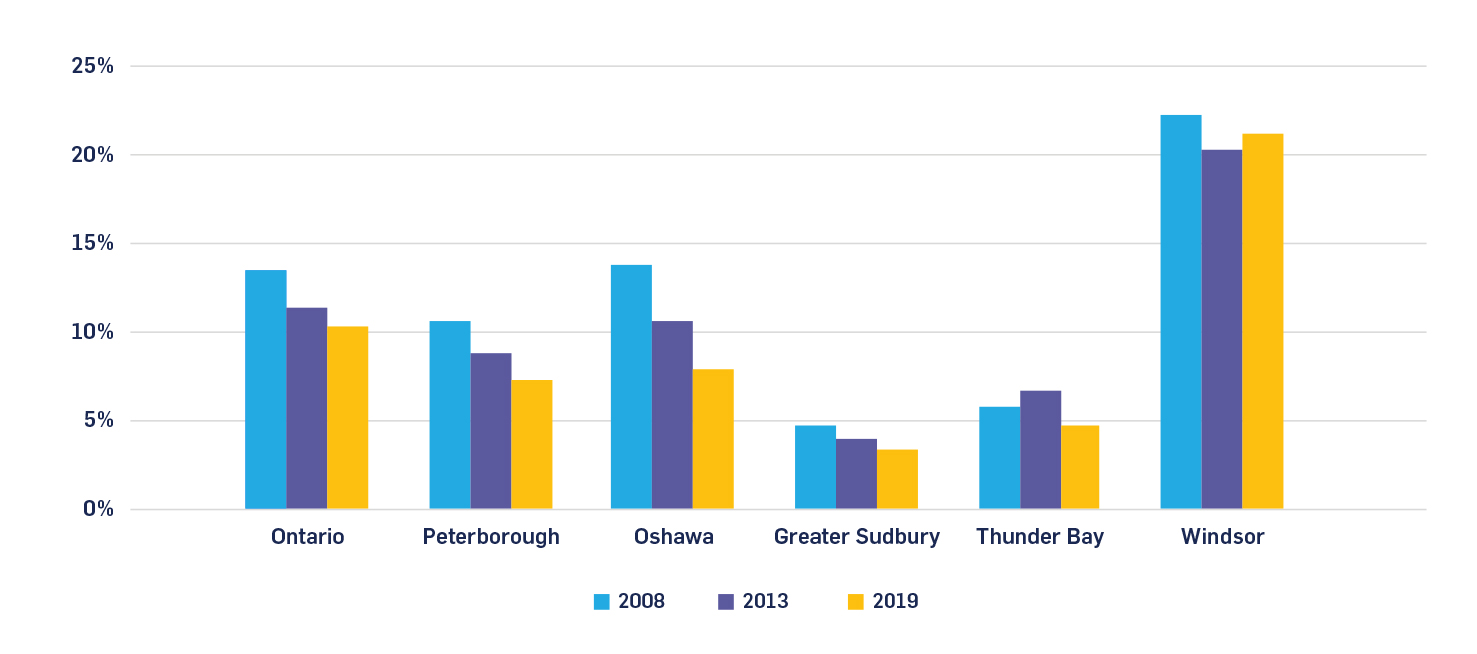
Figure 11: Health-Care & Social Assistance As A Share Of Employment, Ontario As A Whole And Target Cities, 2009 To 2019[85]
Educational attainment
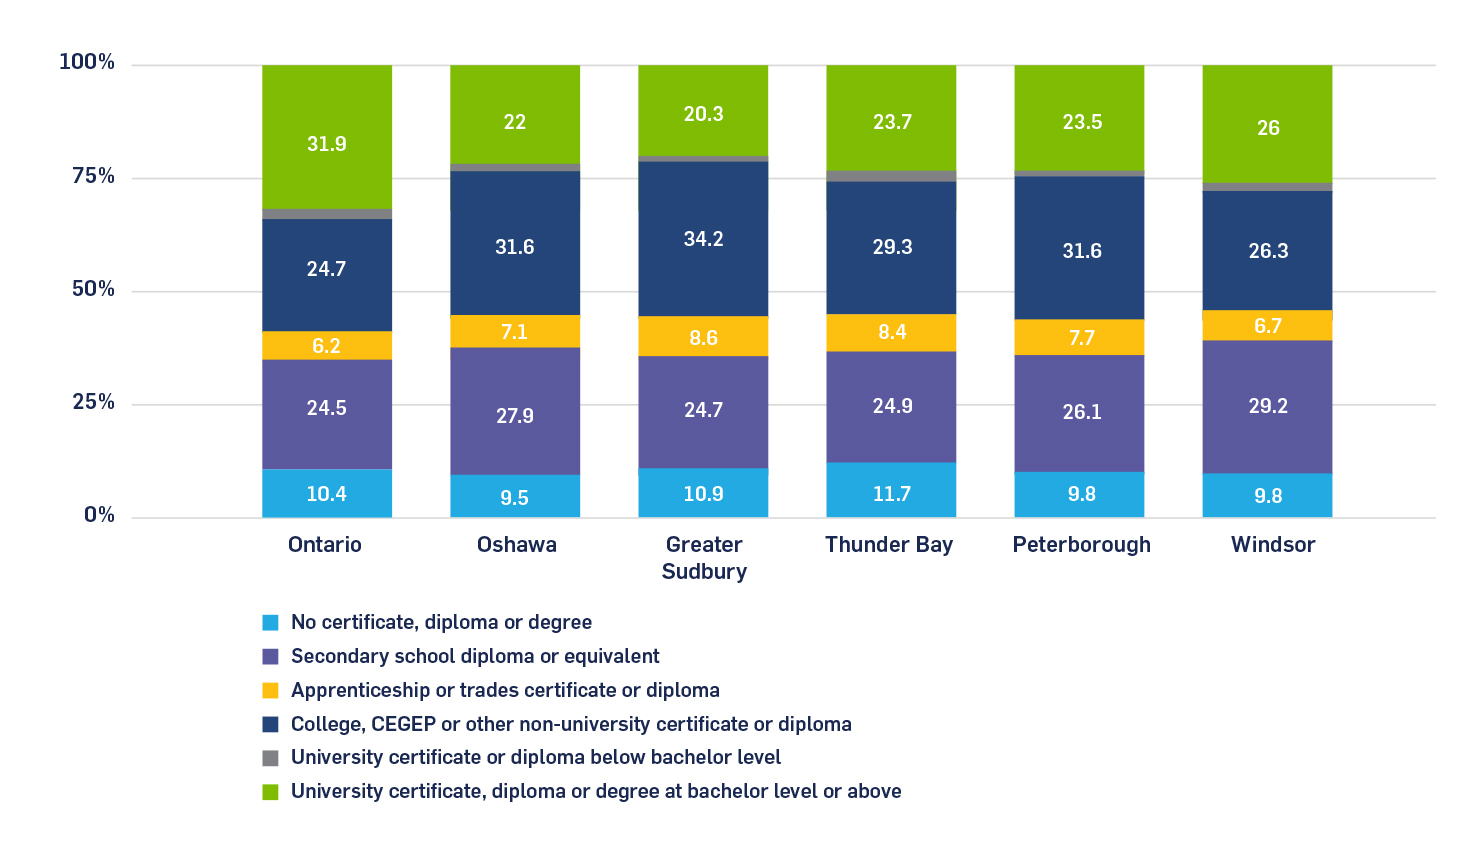
In examining levels of educational attainment, there are common trends across the target cities. All of them have lower proportions of the population with university degrees compared to the Ontario-wide average and a higher proportion with college diplomas as their highest level of attainment, which speaks to the technically focused nature of work in these municipalities (see Figure 12).
All five cities also had a higher share of the population with a high-school diploma as the highest level of attainment compared to the provincial average.
In general, what is most notable is how similar the educational profile is among the target cities, with Windsor coming the closest to the province-wide average in educational attainment and Sudbury the most divergent.
Figure 12: Highest Level Of Educational Attainment, Ontario As A Whole And Target Cities (Ages 25-64), 2016[86]
Public transit usage
All five cities have lower levels of public transit use than Ontario as a whole, with Oshawa as the highest and Windsor as the lowest, with less than 3.5% of the population taking public transit. This speaks to the smaller size and lower density of these cities combined with a lack of public transit infrastructure and a higher reliance on private automobiles (see Figure 13).
Figure 13: Public Transit Users As Share Of Commuters, Ontario As A Whole And Target Cities (2016)[87]
![]()
Crime rates
Statistics Canada’s crime severity index aggregates and weights rates of criminal activity by region and time period. Higher numbers reflect a greater frequency of crime within a metropolitan region (see Figure 14). The Violent Crime Severity Index does the same but only for violent offences (see Figure 15).
During the period analyzed, Oshawa and Peterborough’s crime severity index and violent crime severity index values were lower than Ontario’s as a whole. Sudbury and Thunder Bay’s were significantly higher and remained so from 2006 to 2019.
From 2006 to 2019, crime severity index values uniformly fell across the five cities. Violent severity index rates also fell during the same period, except for Thunder Bay, which saw a significant increase over this period, and Sudbury and Peterborough, which saw minor increases and no change, respectively.
Figure 14: Crime Severity Index, Ontario As A Whole And Target Cities, 2006 To 2019[88]
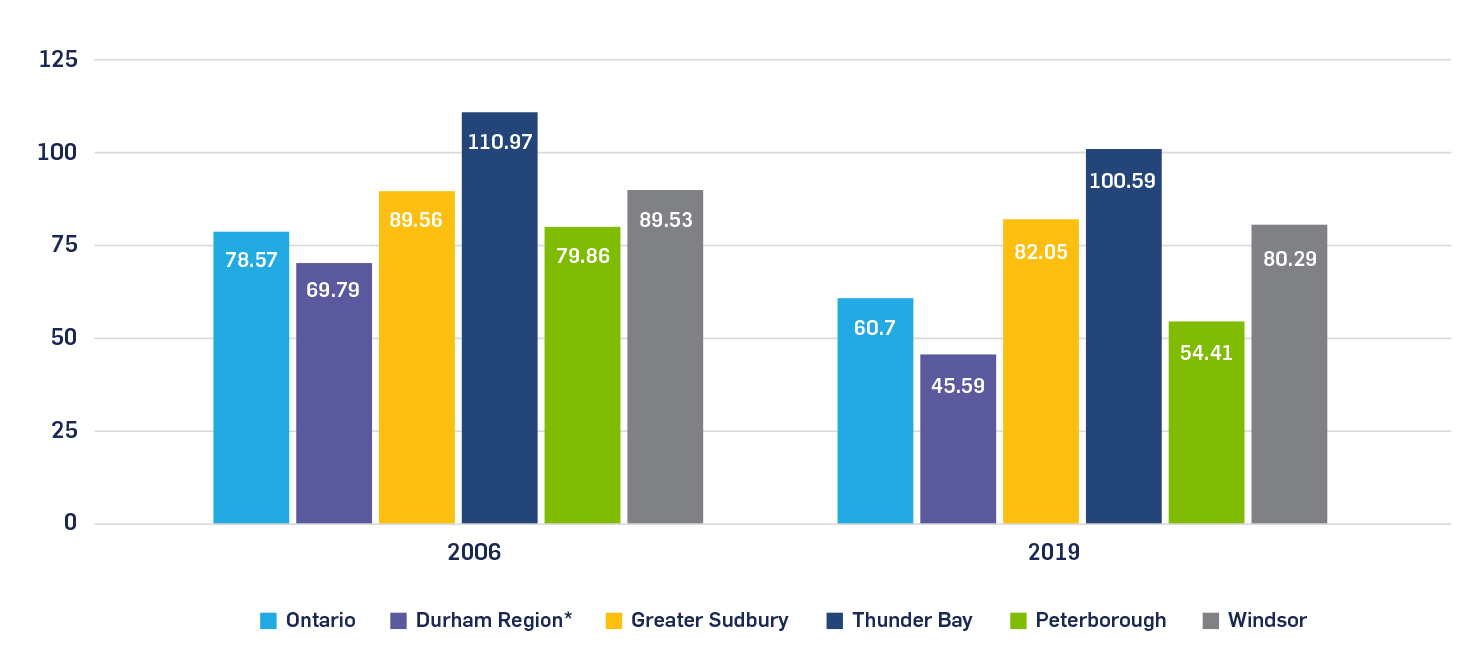
Figure 15: Violent Crime Severity Index, Ontario As A Whole And Target Cities, 2006 To 2019[89]
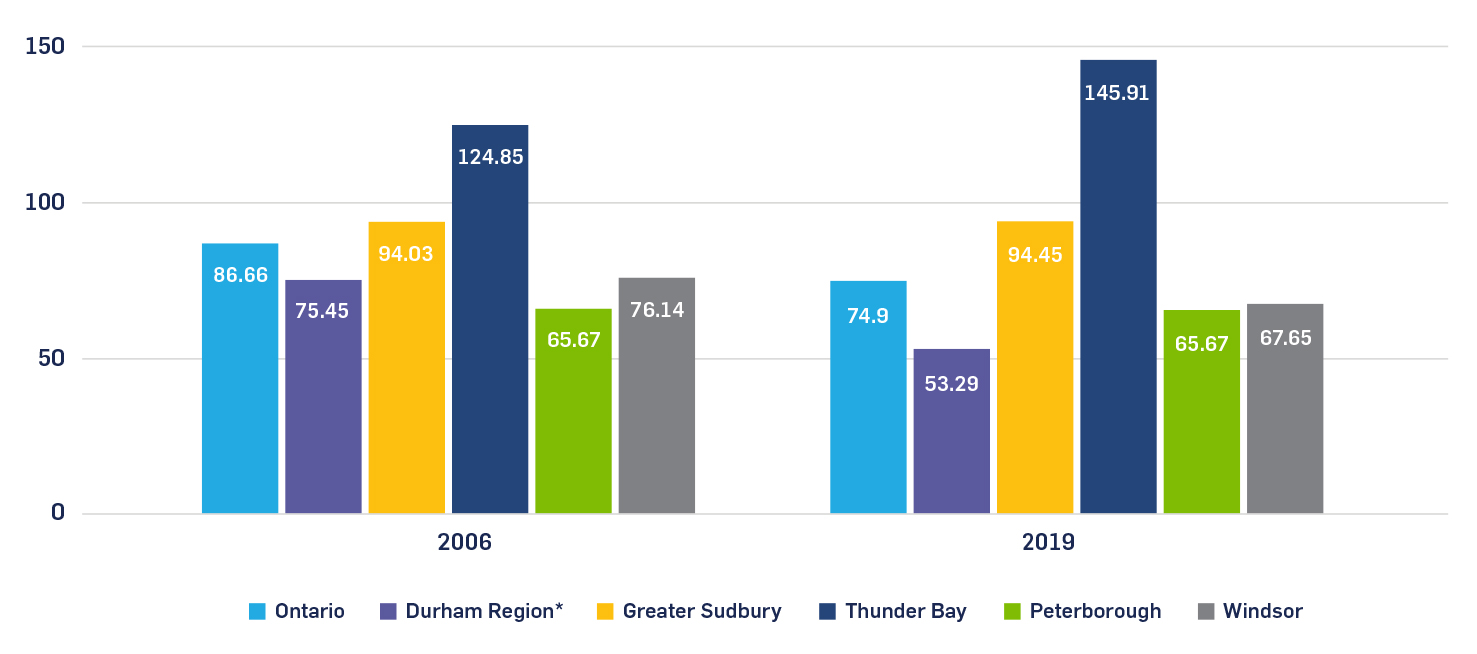
**Data for Oshawa is only available as a part of the larger Durham Region, which includes Whitby and Oshawa.**
Policy Recommendations
The economic regeneration toolkit gives policymakers a framework to assess a community’s strengths and weaknesses as they relate to the drivers of growth, investment, and jobs. Although de-industrialized cities face various challenges, the toolkit can help provincial and local officials to develop economic development strategies that accentuate their strengths and mitigate their weaknesses. The ultimate effectiveness of these strategies will depend on local implementation, on resourcing, and on having the kinds of civic leadership and private sector partnerships that can be leveraged to achieve shared goals.
Any city, regardless of size or location, can benefit, at least on the margins, from policies tied to clear economic development strategies. There is not, however, a single model or single policy to overcome de-industrialization. Each city must develop and adopt its own plan that reflects the city’s strengths and preferences.
This paper has shown how a selection of cities in Ontario share some common challenges, however, due to local contexts (including industrial make-up, proximity to larger centres, demographics, and educational profile), the right mix of policies will necessarily differ from place-to-place.
In practical terms, municipalities need local mayoral and council leadership with the vision and appetite to embrace a new strategy. The City of Windsor in 2020- 21 benefitted from this political leadership. After engaging Public First in summer 2020, a new economic development strategy was designed, drawing on the input of key local stakeholders and based upon the approach set out here. The city’s council unanimously approved the proposed ‘LIFT strategy’ for the future economic regeneration of Windsor and set about putting it into action.
In April, an implementation team was assembled under the city’s new CAO, and a series of new initiatives were being worked on as of summer 2021, including a suite of metrics to track progress, the appointment of a new Commissioner for Economic Development and Innovation, an expanded data capability for the city, and new local and cross-border partnerships with neighbouring Detroit on priority areas like mobility. The council is set to vote on next steps to prioritise in the fall, and to allocate resources accordingly.
Windsor is just at the start of a journey that will take many years, but for the first time in many years, the city now has a roadmap and a clear set of published goals around Location, Infrastructure, Future Economy, and Talent, that it can work towards. The key takeaway from the Windsor experience is that city revitalisation efforts are dependent on all types of stakeholders – including community leaders, businesses, civil society groups, and local residents – playing roles in catalysing investment and opportunity. Having clear metrics reflected in the economic development strategies can help to inform and guide these activities.[90] They also help local residents measure progress and hold policymakers to account.
Annex: Application Of The Regeneration Toolkit To Target Cities
Thunder Bay
History and Forecast
Thunder Bay grew from two separate communities: Fort William, a fur trading post established in the 17th century, and Port Arthur, a railway hub and shipping center for agricultural products from the prairies founded in 1870. With its central position on the Canadian transcontinental railroad and terminus for western grain shipments, Thunder Bay boomed in the first half of the twentieth century. By the 1910s, it had become one of the world’s largest grain processing hubs and was developing strong pulp, paper, manufacturing and mining sectors. Beginning in the 1970s, however, major changes including global economic shifts created major challenges for its traditional industries.[91]
Today, Thunder Bay remains an important port and trans-continental transport hub but it has also become a major regional administrative and services center. Through the expansion of Lakehead University and Confederation College alongside major research institutes, the city has become a leader in Canadian medical research.[92] The Regional Health Sciences Centre is the largest employer in the city and healthcare has become the city’s largest sector of employment.[93] In addition to its traditional industries, the city has grown a major tourism industry and its airport remains one of the busiest in Ontario.[94] Amenities include museums, cultural festivals, and a recently expanded waterfront.
Although the city’s immigrant population is comparatively small, it has a large, young, and rapidly growing Indigenous population which represents 13 percent of the city’s total population.[95]
Thunder Bay’s rapidly aging population and shrinking workforce[96] pose significant challenges for its goals of becoming a major knowledge and innovation hub in Northern Ontario. If the city is not able to resolve its growing labour shortage by drawing talent in from elsewhere in Canada and abroad, Thunder Bay will be increasingly hard-pressed to exploit the advantages of its location and knowledge base.
Application of the Toolkit
SECTORS & CLUSTERS
+ Thunder Bay’s health-care and research sector is a major asset to the city and offers it the opportunity to be a national leader in medical research.
+ Thunder Bay’s port is one of the most important in Canada, carrying major shipments, mostly of Western Canadian produce, to world markets.
− Since the 1970s, many of Thunder Bay’s traditional industries have seen technological transformations necessitating innovation and productivity improvements to compete.
PEOPLE
+ Lakehead University’s strong research focus and recent expansions to its post- secondary educational facilities provide the foundation of a technically-skilled innovation economy.
− An aging and shrinking workforce will create significant labour and talent shortages at a time when Thunder Bay urgently needs to grow and attract talent from across Canada.
AGGLOMERATION
+ Thunder Bay is the largest city in Northwestern Ontario and its strategic position straddling west and central Canada provides opportunities for growth as a regional transport and service hub.
+ Thunder Bay is one of the most affordable cities in Ontario with a high vacancy rate and low housing prices.
− Thunder Bay constitutes an urban island in Northwest Ontario. Its distance from other major cities severely limits the city’s ability to integrate into a larger urban network.
COMPETITIVENESS
+ Thunder Bay’s location in the center of Canada and astride east-west air transport links remains a major economic asset for the city.
− At a time when the city needs new businesses, the Canadian Federation of Independent Business rated it 121st out of 125 Canadian cities in its 2018 entrepreneurial index.[97]
Sudbury
History and Forecast
Greater Sudbury’s fortunes have historically been tied to the mining industry. Situated in the mineral-rich Sudbury basin, which is the impact crater of an ancient meteorite, the city was founded in 1883 and grew to become a major logging and mining center in Northern Ontario. Nickel was the largest export, with Sudbury integrated into global nickel markets as a major supplier in Canada and abroad.[98]
But employment in the mining sector peaked in 1971 and subsequently declined due to the reduced centrality of Sudbury in global nickel extraction and structural changes in the mining industry. The result is that employment in the sector fell and is now only the third largest industry in the city, behind retail trade and health-care and social assistance.[99] Today, the major employer in the industry is Vale Limited, with 4,000 employees in its Sudbury operations.[100]
In addition to being a major regional health and retail centre for Ontario’s north, Sudbury has emerged as a research hub for the physical and environmental sciences through Cambrian College, Laurentian University, and institutes such as NORCAT Innovation.[101] The city is also well-known as a world leader in reforestation efforts, with 3,400 hectares restored and 15 million trees replanted from 1978 to 2011.[102]
Sudbury’s population is diverse, with a significant population of both Indigenous people and Franco-Ontarians. In 2016, 10 percent of the city’s population identified as Indigenous and 25.7 percent held French as a mother tongue.[103] But the city has the second lowest ratio of immigrants among thirty-three major Canadian urban centres.[104]
An aging population, stagnant labour force growth, and the volatility of commodities means Sudbury’s economic challenges are centered on continuing its efforts to diversify and strengthen its importance as a regional services and innovation cluster in Northern Ontario.
Application of the Toolkit
SECTORS & CLUSTERS
+ Sudbury’s historic mining industry continues to be a significant producer of value for the city and a major source of domestic and global investment.
+ The growth of a technically oriented physical sciences and environmental research infrastructure has led the way for transition to a regional innovation hub.
− Volatility in commodity prices and a reduction in global market share has led to a consistent and decades-long decline of employment in the sector.
PEOPLE
+ Established educational institutions such as Laurentian University and Cambrian College offer pathways for the city to invest into and expand its innovation economy.
− Sudbury’s aging population and stagnant workforce creates major challenges for maintaining the talented and technically skilled workforce needed to support an innovation economy.
AGGLOMERATION
+ Greater Sudbury is the largest city in Northern Ontario and serves as a retail and services hub for the entire region, drawing in commerce from communities across the north.
+ Sudbury offers low housing prices and affordable living for new residents to the city.
− Sudbury lacks major infrastructure links to North Bay, the nearest northern city. Expanded highway access is necessary to encourage growth and improve commuter safety.
COMPETITIVENESS
+ The development of the Ring of Fire mining project would offer significant opportunities for Sudbury as a springboard for exploration and technical assistance to companies
− Sudbury’s aging entrepreneur base[105] and low CFIB Index score[106] reflect a lack of incentives and support to new businesses in the city.
Peterborough
History and Forecast
Founded in 1850, Peterborough soon grew as a manufacturing centre. The development of the Trent-Severn waterway in the late nineteenth century as a major hydroelectric asset and navigable pathway attracted both cottage tourism and manufacturing to the region.[107]
The city’s manufacturing employment as a share of total employment fell between the 1970s and the 2000s due to a combination of technology- and trade-induced dislocation. From 2008 to 2019 alone, the share of Peterborough’s population involved in manufacturing fell from 10.6 percent to 7.2 percent. Manufacturing employment fell from the third to fifth most important sector in the city by employment as a result.[108]
Peterborough has a number of major educational institutions, including Fleming College and Trent University. Trent University has recently seen a 42 percent increase in graduate student enrolment, especially from international students, as the university expands its educational capacity.[109]
From 2008 to 2019, the size of Peterborough’s labour force declined[110] and the city has seen negative real GDP and GDP per capita growth[111] since 2008-09. Seniors make up more than a fifth of the city’s population.
There are positive signs too, however. Since 2017-2018, Peterborough has been one of the fastest growing census metropolitan areas in Canada.[112]
Peterborough’s recent growth offers advantages in retaining talent and expanding the city’s labour force, but also puts major pressure on urban planning. The extension of Highway 407 to Highway 115 will accelerate deepened economic links with the GTHA, but it will also accelerate the long-term rise in housing prices and demand for improved urban infrastructure.
Application of the Toolkit
SECTORS & CLUSTERS
+ Peterborough has made significant investments in emerging industries such as cleantech, with a new Cleantech Commons at Trent University.
+ Peterborough has a major tourism industry given its proximity to the Kawartha Lakes, and supported by its access to the GTHA and other major urban centres.
− Stagnant and even negative GDP growth underlines that Peterborough lacks major drivers of dynamism in an economy once centered on manufacturing.
PEOPLE
+ Trent University is a major asset to the city with a growing student population, graduate retention, and growing research focus in areas such as water treatment and conservation.
− Peterborough has one of the oldest populations of any city in Ontario and has seen its workforce decline between 2008 and 2019.
AGGLOMERATION
+ Recent highway extensions, an upgrade of the airport and budding economic connections to nearby Durham Region allow for the city to benefit from wider GTHA growth.
+ A low cost of housing is attracting new residents, especially from the GTHA.
− As of 2017, Peterborough had one of the lowest vacancy rates in the province and rapidly rising housing prices. Expanding the city’s housing supply will be essential.
− A lack of public transit options and especially regional rail connections reduce the advantages of Peterborough’s proximity to other urban centers.
COMPETITIVENESS
+ Although modestly rated by the CFIB as an entrepreneurial community, Peterborough does have a high number of small business owners and established business support.
− Low and even declining GDP and GDP per capita speak to significant issues with attracting investment and spurring productivity growth.
Oshawa
History and Forecast
Founded in 1850, Oshawa grew as a manufacturing and transit hub east of Toronto. In the first half of the 20th century, Oshawa became a major auto manufacturer; indeed, a model city of Ontario’s manufacturing economy. Cars produced in Oshawa were sold in both Canada and the United States and autos remained the city’s largest industry until the 1980s, employing tens of thousands of workers.[113]
However, offshoring and major economic shifts contributed to the decline of automotive manufacturing. The General Motors-owned Oshawa Car Assembly (which was established in 1907) significantly reduced employment in the city over time and almost closed in 2018, a move forestalled by labour action and negotiation that saw the plant reopen in 2021.[114] Since 2019, the industry fell from the second largest to fourth largest employer in the city, behind construction, health-care services, and retail.[115]
Oshawa is gradually growing into a major educational, health and technical center, hosting among other institutions, Ontario Tech University and Durham College. It is now one of the youngest and fastest-growing cities in Canada, and has seen its labour force grow by 20.6 percent from 2008 to 2019, an increase above the provincial average and any other target city.
The reasons behind Oshawa’s growth are multifaceted. Oshawa is extensively linked to downtown Toronto through commuter rail lines such as GO Transit and Via Rail and highways, linking the growing suburbs of Durham Region to other sections of the GTHA.
Oshawa’s renewed growth as both a hub of Durham Region and a spoke in the larger GTHA is an example of the potential of economic regeneration. While population growth creates its own set of issues such as rising house prices and pressure on infrastructure that need to be resolved, it offers opportunities to diversify and grow. The city’s future in the wake of a COVID-19 recovery will be as both the largest city in Durham and a key part of the larger GTHA economic network.
Application of the Toolkit
SECTORS & CLUSTERS
+ Recent investments in health care, retail and construction have allowed Oshawa to diversify away from a singular focus on automotive manufacturing.
+ Oshawa has a growing film industry that has attracted the filming of a number of major recent international film and TV series.
− The city’s manufacturing sector faces serious challenges due to technological and economic shifts in the automotive sector from a traditional, labour-intensive model.
PEOPLE
+ With one of the youngest and fastest-growing populations in the province, Oshawa has the opportunity to expand its investments into health, research, and technical education and training to grow the city’s talent base.
− Growing economic and social disparity that grew during the recent economic boom, including those impacted by manufacturing loss, must be addressed.
AGGLOMERATION
+ As the largest municipality in Durham Region, and with strong transit and highway links to the rest of the GTHA, Oshawa is well-placed to grow as a major regional metropolis.
+ Although housing prices are rising precipitously, Oshawa remains one of the most affordable cities in the GTHA.
COMPETITIVENESS
+ The port offers opportunities for reduced shipping and warehousing costs for international businesses.
− A consistently low GDP per capita in comparison to the Ontario average reflects a lower rate of labour productivity.
− A lack of employment land and the lowest score of any municipality in the GTHA in the CFIB entrepreneurial ranking[116] reflects difficulties for entrepreneurs in Oshawa.
Windsor
History and Forecast
Windsor is located in the southernmost part of Canada, strategically located on the border between Canada and the United States. The city shares a rich automotive manufacturing history and follows similar economic trends to its U.S. neighbour, Detroit.
Windsor has been known as the home of the Canadian car industry since first production at the city’s Ford plant in 1904. However, an abundance of cheap labour abroad eventually led to the offshoring of the automotive industry, which hit Windsor’s economy especially hard. The city lost a total of 11,900 automotive manufacturing jobs between 2001 and 2013 (20 percent of full-time jobs), and median family income fell by 11 percent between 2000 and 2012.[117] The city’s economy also suffered in the wake of the 2008 financial crisis, experiencing population decline, an unemployment peak of 13.9 percent,[118] and a 17 percent decrease in real GDP.[119]
Windsor currently has many strengths – it is one of the most diverse cities in Canada, with immigrants making up 1 in 4 of the city’s residents,[120] and it is a relatively safe city despite its close proximity to the notoriously unsafe city of Detroit.[121] Further, the city benefits from its location, both in terms of its proximity to the U.S. market and its mild climate relative to most other Canadian cities.
Since 2008, Windsor has experienced several years of modest growth and rising employment.[122] The city has tried to build on its historical expertise in the automotive industry to grow the advanced manufacturing sector and to become a hub for the future tech-oriented automotive industry. Manufacturing remains a core pillar of Windsor’s economy; in 2019 manufacturing represented 21% of total employment.
Application of the Toolkit[123]
SECTORS & CLUSTERS
+ Windsor remains one of Canada’s most important manufacturing centres, especially for cars, and the city is working to become a centre for automotibility. Leading manufacturers in other fields (like Jamieson) have made their home in Windsor.
+ The city and surrounding areas have strong tourism assets, with diverse attractions including gaming, food and drink, outdoors and culture.
− Over the last twenty years, auto production in Ontario has been shifting to lower cost locations in Mexico and the US South.
− The automobile industry is expected to experience significant disruption in the coming decades with the rise of electric and self-driving vehicles. Despite recent announcements of new EV investments, it remains unclear how well Windsor is placed to take advantage of these trends.
− Unionised labour with high costs; and other higher costs (such as electricity) can deter investment.
PEOPLE & CULTURE
+ Windsor’s population continues to climb, suggesting the area has appeal to local and international migrants.
+ The area has a history of high skilled manufacturers in the tool and die industry.
− The share of graduates in the Windsor labour market (25.2%), remains below the national average (28.5%). By urban area, Windsor has the 15th highest population, but only the 41st highest share of graduates. The city continues to see a net loss of graduate talent.
− The University of Windsor is academically strong.
− The University of Windsor is stronger in teaching than research, however, and it has not built up sufficient strength in automotive research.
− There appears to be a lack of amenities for young graduates.
AGGLOMERATION
+ The city is located next to one of the most important manufacturing centres in the US, in Detroit. There is already significant collaboration between companies on both sides of the border, and potential for further economies of scale between the two cities.
+ Affordability of housing is a key strength (though presumably if Windsor began to grow faster economically, and did not keep pace with housing supply, this would change).
+ A new cross-border bridge (the Gordie Howe International Bridge) will allow more rapid access to Detroit and the rest of Michigan.
− Windsor is too distant to form an effective economic agglomeration with other major cities in Ontario, and public transport links between them are weak. Windsor, internally, is a very car-centred city.
− This means that Windsor is dependent on Detroit for agglomeration – a reviving city, but one with major risks, and with border issues.
− While rental prices in Windsor are among the lowest in Ontario, the level of vacancies remains low.
COMPETITIVENESS
+ Windsor remains a cost competitive location for businesses. In 2016, KPMG estimated a cost index of 84.3 for Windsor-Essex, compared to a benchmark average of 100 for the US.
− While Windsor has been catching up in recent years, GDP per capita remains around three quarters of the national average, suggesting relatively low productivity.
− Local government in Windsor does not have the ability to match US economic incentives.
Blair Gibbs is a policy consultant and writer who served as a senior advisor to the U.K. Prime Minister in the No10 Policy Unit (2019-20). His policy specialism is home affairs and security, including migration, policing and drug policy. He studied history and politics at Oxford University and held several senior roles in government 2012-20 including in the London Mayor’s Office and Ministry of Justice. He sits on the board of the network for addiction policy at Stanford University and writes on British politics and global affairs for TheHub.ca and CapX. He now lives with his family in Vancouver, BC.
Luka Glozic is an independent policy consultant and recent graduate from the Munk School of Public Policy and Global Affairs. He specializes in long-term economic, labour and urban policy issues. He was previously a researcher for the 2019 independent review of the Ontario Workplace Safety Insurance Board. He is currently engaged with research and analysis for the Ontario 360 project.
Carly Munnelly is a Policy Manager within the Charity and Public Sector practice at Public First. She holds a Bachelor’s degree in Economics from Boston College, and a Master’s degree in International Development from King’s College London. Her main policy focuses are overseas aid and economic regeneration.
For more information about Ontario 360 and its objectives contact:
Sean Speer
Project Director
[email protected]
Drew Fagan
Project Director
[email protected]
on360.ca
NOTES
[1] Government of Ontario, A Plan to Build Ontario Together: 2019 Ontario Economic Outlook and Fiscal Review, November 2019. https://budget.ontario.ca/2019/fallstatement/pdf/2019-fallstatement.pdf.
[2] Council of the Federation, “Premiers United, Call for Federal Partnership and Action,” December 2, 2019. https://www.canadaspremiers.ca/wp-content/uploads/2019/12/COF_Communique-Dec2.pdf.
[3] Dan Irvine, (2014) “Local and Regional Labour Market Trends in the Canadian Automotive Manufacturing Industry,” Automotive Policy Research Centre, December 2014.
[4] Weseem Ahmed, Measuring Ontario’s Urban-Rural Divide, Ontario 360, November 13, 2019. https://on360.ca/policy-papers/measuring-ontarios-urban-rural-divide/.
[5] Richard Florida, “Why America’s richest cities keep getting richer,” The Atlantic, April 12, 2017. https://www.theatlantic.com/business/archive/2017/04/richard-florida-winner-take-all-new-urban-crisis/522630/.
[6] Enrico Moretti, The New Geography of Jobs, (New York City: Mariner Books, 2012).
[7] Gary Paul Green, “Deindustrialization of rural America: Economic restructuring and the rural ghetto,” Local Development & Strategy, Volume 1, Issue 1, 2020. https://www.tandfonline.com/doi/full/10.1080/26883597.2020.1801331.
[8] Mike Moffatt, Aline Coutinho, and John McNally, Made in Ontario: A Provincial Manufacturing Strategy, Ontario 360, June 7, 2021. https://on360.ca/policy-papers/made-in-ontario-a-provincial-manufacturing-strategy/.
[9] Sean Speer and Sosina Bezu, Job Polarization in Canada, Public Policy Forum and Diversity Institute, May 5, 2021. https://www.ryerson.ca/diversity/reports/job-polarization-in-canada/.
[10] Lorenzo Gonzales and Sean Speer, Opportunity Zones: An Opportunity for Ontario, Ontario 360, November 13, 2019. https://on360.ca/policy-papers/opportunity-zones-an-opportunity-for-ontario/.
[11] Windsor Works: An Economic Development Strategy for the City’s Future Growth’, Public First, February 2021. https://www.citywindsor.ca/mayorandcouncil/Documents/Windsor-Works-Report.pdf.
[12] Oliver Farhauer and Alexandra Kroll, “Diversified specialisation – going one step beyond regional economics’ specialisation-diversification concept,” Jahrbuch für Regionalwissenschaft, Volume 32, 2012.
[13] Max Nathan and Henry Overman, “Agglomeration, clusters, and industrial policy,” Oxford Review of Economic Policy, Volume 29, Issue 2, 2013.
[14] Scott Andes, Mitch Horowitz, Ryan Helwig, Bruce Katz, Capturing the next economy: Pittsburgh’s rise as a global innovation city, Brookings, 2017.
[15] Dani Rodrik, Industrial Policy for the Twenty-First Century, CEPR Discussion Paper 4767, Centre for Economic Policy Research, 2004.
[16] What Works Centre for Local Economic Growth, Evidence Review 9: Innovation: R&D tax credits, October 2015.
[17] Paul Cunningham and Abdullah Gök, “The Impact and Effectiveness of Policies to Support Collaboration for R&D and Innovation,” NESTA Working Paper No. 12/06, March 2012.
[18] Girish Bahal, Mehdi Raissi and Volodymyr Tulin, “Crowding-Out of Crowding-In? Public and Private Investment in India,” IMF Working Paper, December 2015. https://www.imf.org/external/pubs/ft/wp/2015/wp15264.pdf
[19] Jamison Steeve and Sean Speer, Re-imagining Ontario’s Business Support Programs, Ontario 360, November 20, 2019. https://on360.ca/policy-papers/re-imagining-ontarios-business-support-programs/.
[20] What Works Centre for Local Economic Growth, Evidence Review 9: Innovation: R&D tax credits, October 2015.
[21] Ruth Claxton and Georgia Siora, Retail-led regeneration: Why it matters to our communities, DTZ Consulting, 2008. https://www.propertyweek.com/download?ac=1634119.
[22] Government of Canada, Retail Trade 2018-2020, 2020. https://www.jobbank.gc.ca/content_pieces-eng.do?cid=15380.
[23] Chris Rhodes and Georgia Hutton, Briefing Paper: Retail Sector in the UK, House of Commons Library, 25 May 2021.
[24] Pedro Porfirio Coutinho Guimarães, “An evaluation of urban regeneration: the effectiveness of a retail-led project in Lisbon,” Urban Research & Practice, Volume 10, Issue 3, 2017. https://doi.org/10.1080/17535069.2016.1224375
[25] Peter Tyler, Colin Warnock, Allan Provins and Bruno Lanz, “Valuing the Benefits of Urban Regeneration,” Urban Studies , Volume 50, Issue 1, 2013. https://doi.org/10.1177%2F0042098012452321.
[26] Anne Findlay and Leigh Sparks, Literature Review: Policies Adopted to Support a Healthy Retail Sector and Retail Led Regeneration and the Impact of Retail on the Regeneration of Town Centres and Local High Streets, Scottish Government Social Research, 2009. https://dspace.stir.ac.uk/bitstream/1893/11857/1/Sparks_2009_Literature_review_main_report.pdf
[27] Paul Greenhalgh, Mary Lou Downie and Peter Fisher, “An Investigation of the Response of Industrial and Office Property Occupiers to Property-led Urban Regeneration Policies in Tyne and Wear,” Property Management, Volume 18, Issue 1, 2000.
[28] Americans for the Arts, Arts and economic prosperity III: The economic impact of nonprofit arts and culture organizations and their audiences, National report, Washington DC: Americans for the Arts, 2007. ; Arthur Sterngold, “Do economic impact studies misrepresent the benefits of arts and cultural organizations?” Journal of Arts Management, Law, and Society, Volume 34, Issue 3, 2004. https://doi.org/10.3200/JAML.34.3.166-187
[29] Mark Stern and Susan Seifert, “Cultural clusters: The implications of cultural assets agglomeration for neighborhood revitalization,” Journal of Planning Education and Research, Volume 29, Issue 3, 2010.
[30] What Works Centre for Local Economic Growth, Evidence Review 3: Sports and Culture, 2016.
[31] Mark Stern and Susan Seifert, “Cultural clusters: The implications of cultural assets agglomeration for neighborhood revitalization,” Journal of Planning Education and Research, Volume 29, Issue 3, 2010.
[32] Social Impact of the Arts Project Arts-in-place: Philadelphia’s cultural landscape. A summary of the University of Pennsylvania Urban Studies Program Third Annual Public Conversation 2003-04, 2005.
[33] Marie Howland, “Employment Effects of Brownfield Redevelopment: What Do We Know from the Literature?” Journal of Planning Literature, 2007.
[34] Marie Howland, “Employment Effects of Brownfield Redevelopment: What Do We Know from the Literature?” Journal of Planning Literature, 2007.
[35] Christopher De Sousa, Changshan Wu and Lynne Westphal, “Assessing the Effect of Publicly Assisted Brownfield Redevelopment on Surrounding Property Values,” Economic Development Quarterly, 2009.
[36] Edward Glaeser and Joshua Gottlieb, “The Economics of Place-Making Policies.,” Brookings Papers on Economic Activity, Spring 2008.
[37] What Works Centre for Local Economic Growth, Evidence Review 5: Estate Renewal, 2015.
[38] Ching-Fu Chang, Ping Wang and Jin-Tan Liu, “Knowledge spillovers, human capital and productivity,” Journal of Macroeconomics, Volume 47, Issue PB, 2016.
[39] Andrea Bonaccorsi, Daniele Biancardi, Mabel Sanchez-Barrioluengo and Federico Biagi, “Study on Higher Education Institutions and Local Development,” Publications Office of the European Union, 2019.
[40] Ursula Kelly, Ian McNicoll and James White, The Impact of Universities on the UK Economy, Produced for Universities UK, 2014.
[41] Andrea Bonaccorsi, Daniele Biancardi, Mabel Sanchez-Barrioluengo and Federico Biagi, “Study on Higher Education Institutions and Local Development,” Publications Office of the European Union, 2019.
[42] Laura Abramovsky, Rupert Harrison and Helen Simpson, “University Research and the Location of Business R&D,” The Economic Journal, Volume 117, Issue 519, 2007.
[43] Laura Abramovsky and Helen Simpson, “Geographic proximity and firm–university innovation linkages: evidence from Great Britain,” Journal of Economic Geography, Volume 11, Issue 6, 2011.
[44] Stephen Gibbons, “Planes, Trains and Automobiles: The Economic Impact of Transport Infrastructure,” SERC Policy Paper #13, Spatial Economics Research Centre, LSE, 2015.
[45] Ed Cox and Bill Davies, Still on the Wrong Track: An Updated Analysis of Transport Infrastructure Spending, IPPR North, June 2013.
[46] Stephen Gibbons, “Planes, Trains and Automobiles: The Economic Impact of Transport Infrastructure,” SERC Policy Paper #13, Spatial Economics Research Centre, LSE, 2015.
[47] What works centre for local economic growth, Evidence Review 7: Transport, 2015.
[48] Taotao Deng, “Impacts of Transport Infrastructure on Productivity and Economic Growth: Recent Advances and Research Challenges,” Transport Reviews, Volume 33, Issue 6, 2013.
[49] What Works Centre for Local Economic Growth, Evidence Review 10. Area Based Initiatives: Enterprise Zones, 2016.
[50] Frank Beck, “Do State-Designated Enterprise Zones Promote Economic Growth?” Sociological Inquiry, Volume 71, Issue 4, 2007.
[51] What Works Centre for Local Economic Growth, Evidence Review 10. Area Based Initiatives: Enterprise Zones, 2016.
[52] Centre for Cities, “In the zone? Have enterprise zones delivered the jobs they promised?” 2019.
[53] Matias Busso, Jesse Gregory and Patrick Kline “Assessing the Incidence and Efficiency of a Prominent Place Based Policy,” American Economic Review, Volume 103, Issue 2, 2013.
[54] Edward Glaeser and Joshua Gottlieb, “The Economics of Place-Making Policies.,” Brookings Papers on Economic Activity, Spring 2008.
[55] Andrew Wainer, “A Tale of Two Cities (and a Town): Immigrants in the Rust Belt,” Bread for the World Institute briefing paper, Number 23, October 2013. https://www.bread.org/sites/default/files/downloads/briefing-paper-23.pdf
[56] Andrew Wainer, “Immigrants Injecting Life into the Rust Belt: in places like Baltimore, Detroit, and rural southeastern Iowa, immigration has slowed – and in some cases reversed – decades of population loss,” The Atlantic, October 29, 2013. https://www.theatlantic.com/politics/archive/2013/10/immigrants-injecting-life-into-therust-belt/430314/
[57] New American Economy, “New Americans and a New Direction: The Role of Immigrants in Reviving the Great Lakes Region,” Partnership for a New American Economy Research Fund, October 2017.
[58] New American Economy, “New Americans and a New Direction: The Role of Immigrants in Reviving the Great Lakes Region,” Partnership for a New American Economy Research Fund, October 2017.
[59] Christian Dustmann and Tommaso Frattini, “The Fiscal Effects of Immigration to the UK,” Economic Journal, 2014.
[60] Thorsten Beck and Asli Demirguc-Kunt, “Small and medium-size enterprises: Access to finance as a growth constraint,” Journal of Banking & Finance, Volume 30, Issue 11, 2006.
[61] Meghana Ayyagari, Asli Demirguc¸-Kunt, Vojislav Maksimovic, “How important are financing constraints? The role of finance in the business environment,” World Bank Economic Review, Volume 22, Issue 3, 2005.
[62] What Works Centre for Local Economic Growth, Evidence Review 4: Access to Finance, 2016.
[63] What Works Centre for Local Economic Growth, Evidence Review 4: Access to Finance, 2016.
[64] Amy Goldstein, Janesville: An American Story, (New York: Simon & Schuster, 2017).
[65] Darryn Snell, “Vocational education and the revitalisation of manufacturing in the United States,” Journal of Vocational Education & Training, Volume 71, Issue 2, 2017.
[66] David North, Stephen Syrett, David Etherington and Ian Vickers, Interventions to tackle the economic needs of deprived areas: Analysis of six policy case studies. Joseph Rowntree Foundation, 2007
[67] What Works Centre for Local Economic Growth, Evidence Review 1: Employment Training, 2016.
[68] David Bailey, Caroline Chapain, Alex de Ruyter, “Employment Outcomes and Plant Closure in a Post industrial City: An Analysis of the Labour Market Status of MG Rover Workers Three Years On,” Urban Studies, Volume 49, Issue 7, 2011.
[69] Amy Goldstein, Janesville: An American Story, (New York: Simon & Schuster, 2017).
[70] Statistics Canada, “Population estimates, July 1, by census metropolitan area and census agglomeration, 2016 boundaries,” 2021 & Statistics Canada, “Population estimates on July 1st, by age and sex” 2021.
[71] Statistics Canada, “Population estimates, July 1, by census metropolitan area and census agglomeration, 2016 boundaries,” 2021 & Statistics Canada, “Population estimates on July 1st, by age and sex” 2021.
[72] Statistics Canada, “Population estimates, July 1, by census metropolitan area and census agglomeration, 2016 boundaries,” 2021 & Statistics Canada, “Population estimates on July 1st, by age and sex” 2021.
[73] Statistics Canada, “2016 Census of Population – Census Profile” 2021. Census data on age was gathered for Oshawa, Greater Sudbury, Thunder Bay & Peterborough.
[74] Statistics Canada, “Population Estimates by July 1st,” & Statistics Canada “Population Estimates, July 1st, by CMA”, 2021.
[75] Statistics Canada, “Population Estimates by July 1st,” & Statistics Canada “Population Estimates, July 1st, by CMA”, 2021.
[76] Statistics Canada, “2016 Census of Population – Census Profile,” 2021. Census data on immigration period was gathered for Oshawa, Greater Sudbury, Thunder Bay & Peterborough, and Windsor.
[77] For the period analyzed, COMEX copper prices reached a peak in 2011 around the same time as Sudbury’s own growth peak, then slowly declined with a major fall in price in 2016, followed by a recovery in 2017. See Macrotrends, “Copper Prices – 45 year Historical Chart”, 2021, https://www.macrotrends.net/1476/copper-prices-historical-chart-data for more data.
[78] Statistics Canada, “Gross domestic product (GDP) at basic prices, by census metropolitan area (CMA) (x 1,000,000),” 2021.
[79] Statistics Canada, “Gross domestic product (GDP) by CMA,” 2021 ; Statistics Canada, “Population estimates, by CMA,” 2021 ; Statistics Canada, “Population estimates,” 2021. GDP per Capita was derived from population and GDP figures already provided.
[80] Statistics Canada, “Median household total income and after-tax income by household type (total – household type including census family structure), Canada and census metropolitan areas, 2016 Census – 100% Data, 2006 Census – 20% Sample data,” 2017.
[81] Statistics Canada, “Labour force characteristics by census metropolitan area, annual, inactive,” 2021.
[82] Statistics Canada, “Labour force characteristics by province, territory and economic region, annual, inactive,” 2021.
[83] Statistics Canada, “Employment by industry, annual, provinces and economic regions, inactive,” 2021 & Statistics Canada, “Employment by industry, annual, census metropolitan areas, inactive (x 1,000),” 2021.
[84] Statistics Canada, “Employment by Industry,” (2021) & Statistics Canada, “Employment by Industry by CMA” 2021.
[85] Statistics Canada, “Employment by Industry,” (2021) & Statistics Canada, “Employment by Industry by CMA” 2021.
[86] Statistics Canada, “Education Highlight Tables, 2016 Census,” 2017.
[87] Statistics Canada, “Commuting Flow from Geography of Residence to Geography of Work – Census Metropolitan Areas and Census Agglomerations,” 2019.
[88] Statistics Canada, “Crime severity index and weighted clearance rates, Canada, provinces, territories and Census Metropolitan Areas,” 2021.
[89] Statistics Canada, “Violent crime severity index and weighted clearance rates, Canada, provinces, territories and Census Metropolitan Areas,” 2021.
[90] Sean Speer, Drew Fagan, and Luka Glozic, Grow Ontario Stronger: A Framework for the Ontario Government’s Post- Pandemic Recovery Plan, Ontario 360, October 1, 2020. https://on360.ca/policy-papers/grow-ontario-stronger-a-framework- for-the-ontario-governments-post-pandemic-recovery-plan/.
[91] Livio Di Matteo, “Thunder Bay’s economic hardships are a sign of things to come for the rest of Canada,” Globe and Mail, December 22, 2019.
[92] Thunder Bay Community Economic Development Commission, “Supporting and Enhancing Business in Thunder Bay,” 2017.
[93] Statistics Canada, “Employment by Industry by CMA,” 2021.
[94] Statistics Canada, “Air passenger traffic at Canadian airports, annual,” 2021.
[95] Immigration, Refugees & Citizenship Canada, “Economic Profile Series: Thunder Bay, Ontario,” 2020.
[96] Statistics Canada, “Population estimates, by CMA,” 2021.
[97] Ted Mallet and Andreea Bourgeois, “Entrepreneurial Communities: Canada’s top places to start and grow businesses in 2018,” Canadian Federation of Independent Business, April 2019.
[98] Oiva Saarinen, “Sudbury: A Historical Case Study of Multiple Urban-Economic Transformation,” Ontario History, Volume 82, Issue 1, March 1990.
[99] Statistics Canada, “Employment by Industry by CMA,” 2021.
[100] Vale Canada, “About Vale – Communities – Sudbury,” 2017.
[101] Federation of Canadian Municipalities, “Sudbury’s Transformation,” 2018.
[102] Federation of Canadian Municipalities, “Case Study: The Re-Greening of Sudbury, Ontario,” 2016.
[103] Immigration, Refugees & Citizenship Canada [IRCC], “Economic Profile Series: Sudbury, Ontario,” 2020.
[104] IRCC, “Economic Profile Series: Sudbury, Ontario,” 2020.
[105] IRCC, “Economic Profile: Sudbury”, 2020.
[106] Ted Mallet and Andreea Bourgeois, “Entrepreneurial Communities: Canada’s top places to start and grow businesses in 2018,” Canadian Federation of Independent Business, April 2019.
[107] Daniel Francis, “Towards a History of the Kawartha-Otonabee Sector of the Trent-Severn Waterway,” Parks Canada, 1980.
[108] Statistics Canada, “Employment by Industry by CMA,” 2021.
[109] Trent University, “Trent University Welcomes Record Number of Graduate Students,” 2018.
[110] Statistics Canada, “Employment by Industry by CMA,” 2021.
[111] Statistics Canada, “Gross domestic product (GDP) by CMA,” 2021.
[112] Will Pearson, “Peterborough has big-city appeal, but it’s facing big-city problems,” TVO, February 13, 2020.
[113] Jamie Bradburn, “How Oshawa became Canada’s Motor City,” TVO, November 29, 2018.
[114] “Oshawa assembly plant restart ahead of schedule, GM Canada says,” Toronto Star, May 5 2021.
[115] Statistics Canada, “Employment by Industry by CMA,” 2021.
[116] Ted Mallet and Andreea Bourgeois, “Entrepreneurial Communities: Canada’s top places to start and grow businesses in 2018,” Canadian Federation of Independent Business, April 2019.
[117] Dan Irvine, (2014) “Local and Regional Labour Market Trends in the Canadian Automotive Manufacturing Industry,” Automotive Policy Research Centre, December 2014.
[118] Statistics Canada, “Labour force characteristics, annual,” 2021.
[119] Public First, Windsor Works: An economic development strategy for the city’s future growth, 2021.
[120] The City of Windsor, “Diversity,” 2021. https://www.citywindsor.ca/business/physician-recruitment/Live/Pages/Diversity-.aspx.
[121] Statistics Canada. Table 35-10-0026-01 Crime severity index and weighted clearance rates, Canada, provinces, territories and Census Metropolitan Areas, 2021.
[122] Statistics Canada, Gross domestic product (GDP) at basic prices, by census metropolitan area, 2021.
[123] 123 The analysis for Windsor was taken from the ‘Windsor Works’ report, produced for the Mayor and Council of the City of Windsor by Public First, published in February 2021. The original report can be found here.