Policy Papers
ON360 Transition Briefings – After The Storm: An Overview Of Ontario’s Fiscal Challenges
This report analyzes Ontario’s public finances from a historical and current perspective within the framework of the needs and issues that have emerged since the pandemic.
Introduction
Ontario, like the rest of Canada and the world, has been battered by COVID-19 with the late fall of 2021 and winter 2022 now seeing a fifth wave dominated by the highly transmissible Omicron variant.[1] As of mid-January 2022,[2] Ontario has seen a total of 926,904 confirmed cases of COVID-19 and 10,522 deaths of which 58 percent were individuals aged 80 and over. There has been a total of 34,636 cases ever hospitalized and 6,705 cases ever hospitalized in the province’s ICUs.
Along with the strains on the province’s health care system by the pandemic, the collateral impact of shutdowns and lockdowns and closures on the province’s economy and social fabric has also been large. Then there is the matter of the province’s public finances not only during the pandemic but going forward. The provincial government will be faced with numerous spending and resource demands to address not only the immediate aftermath of the pandemic on health and education but a variety of challenges dealing with the social and economic fabric of the province ranging from housing costs to inequality to business investment which have been exacerbated by the pandemic shock.
This report analyzes Ontario’s public finances from a historical and current perspective to separate out long-term trends from the impact of the recent pandemic years. This report will preface the fiscal situation with an overview of the economic and social environment to provide the context for fiscal decision making. The context for a discussion of Ontario’s public finances requires an acknowledgement of the numerous issues that will generate competing demands for government resource allocation decisions in the coming years. Therefore, any analysis of the current fiscal situation and long-term trends as well as ultimate fiscal sustainability must occur within the framework of the needs and issues that have emerged in Ontario. Scarce fiscal resources will inevitably require government to conduct exercises in prioritization.
The Fiscal Context
The aftermath of the pandemic on the province’s economic, health and social fabric poses challenges for provincial public finances for two major reasons. First, the province’s public finances have been challenged for some time with concerns about long-term sustainability.[3] Second, along with the direct pandemic impact on the province’s social, health and education sectors and business environment, there will be an aftermath dealing with the shortcomings that the pandemic has revealed as well as the new issues generated. In some respects, the pandemic has forced an inspection effect not least of which has been a highlighting of shortcomings of a provincial health care system lacking surge capacity in times of crisis.
In the case of sustainability, recent years have seen the provincial Auditor General and the province’s Financial Accountability Office as well as the federal Parliamentary Budget Office all noting the challenges facing the province’s finances – that is having the fiscal resources to meet the expenditure demands being made.[4] At the same time, the most recent report of the federal Parliamentary Budget Office noted that fiscal policy in Ontario is currently sustainable[5] provided Ontario’s lower long-run effective interest rates on its debt continue to contribute to the favourable differential between interest rates and economic growth and given that Ontario currently spends less on health care as a share of GDP than the national average.[6] Changes in any of these variables over the medium term will have an impact on Ontario’s fiscal sustainability. Of concern for the immediate future are increases in government spending to deal with the impact of the pandemic on provincial services as well as the potential for increases in interest rates.
As for the impact and aftermath on the provincial fabric, here there is no shortage of potential candidates for more government intervention. The shock of the pandemic has exacerbated some of the long-standing weakness in business investment in the province as well as social issues particularly in education, health care, housing costs and affordability, economic inequality, and poverty. For example, in education, the effects of school closures on learning and outcomes as well as the impact on children’s mental health will linger for years with additional impacts on human capital acquisition and lifetime earnings not to mention the future calibre of the labour force.[7]
In the case of housing, Ontario has seen large increases in housing prices driven by pandemic savings acquired by the more affluent, low interest rates, population growth and supply side issues. By way of example, since January of 2015, the Teranet housing price index for Toronto has risen by 97 percent while that for Ottawa rose by 71 percent.[8] As a result of rising population and slow supply growth, Ontario now has the lowest total private dwellings to population ratio of the ten provinces. A recent Scotiabank report notes Ontario requires 650,000 new homes for its dwellings to population ratio to equal the average for the country.[9] The housing shortage has also spilled over into rental accommodation where high rents are not just a feature of the GTA but have spilled over into surrounding communities such as Barrie or St. Catharines.[10]
Higher housing costs have stretched family budgets fueling homelessness and poverty. A report by the Canadian Centre for Policy Alternatives[11] notes that notwithstanding improvements since 2013, in 2019 one in six children across the province still lived with the day-to-day reality of never having enough. Despite recent progress—the child poverty rate fell from 23.4% in 2013 to 17.6% in 2019—half a million children still lived in poverty in 2019. The provincial Financial Accountability Office[12] reported that since 2000, Ontario has experienced the slowest growth in median family income amongst all the provinces with a modest increase in the inequality of market income over time as well as a decline in relative income mobility indicating that income distribution in Ontario has become more ossified over the last 35 years.
Health services and spending response in Ontario have proven important pandemic issues and there will be demands for additional health investments in the wake of the relative underinvestment that occurred prior to the pandemic. Along with the mortality impact of the first waves on the provincial population and especially long-term care homes, there have been capacity constraints in hospital beds and staffing shortages (necessitating lockdowns that have been among some of the longest in the world) to manage pandemic surges, given per capita hospital bed and health professional numbers that are amongst the lowest in the developed world.[13] According to the OECD Health Statistics 2021, beds per 1,000 population for 38 developed countries ranged from a high of 12.84 for Japan to a low of 1 for Mexico with Canada 32nd at 2.5. Ontario in 2019-20 according to the CIHI (2021a) had a total of 32,767 hospital beds which based on a provincial population of 14.745 million results in 2.2 beds per thousand population.
According to data from the CIHI National Health Expenditure Trends 2021 (CIHI 2021b) release, total provincial government health spending in Ontario rose an estimated 14.2 percent – from $63.1 billion in 2019 to $72.0 billion in 2020 – and is expected to rise 4.4 percent to $75.2 billion in 2021. Like other provinces, Ontario received COVID-19 response funding from the federal government during the pandemic. The COVID-19 response funding included funds for treatment costs, testing, contact tracing, vaccination, medical goods, and other related expenses. Ontario received $4.625 billion in COVID response funding in 2020 and is expected to receive $3.531 billion in 2021. In the absence of COVID-19 support, Ontario’s health spending rises nearly 7 percent in 2020 and just over 6 percent in 2021. Thus, much of the new health spending came from the province’s own resources with annual increases much larger than prior to the pandemic especially after adjusting for inflation and population.
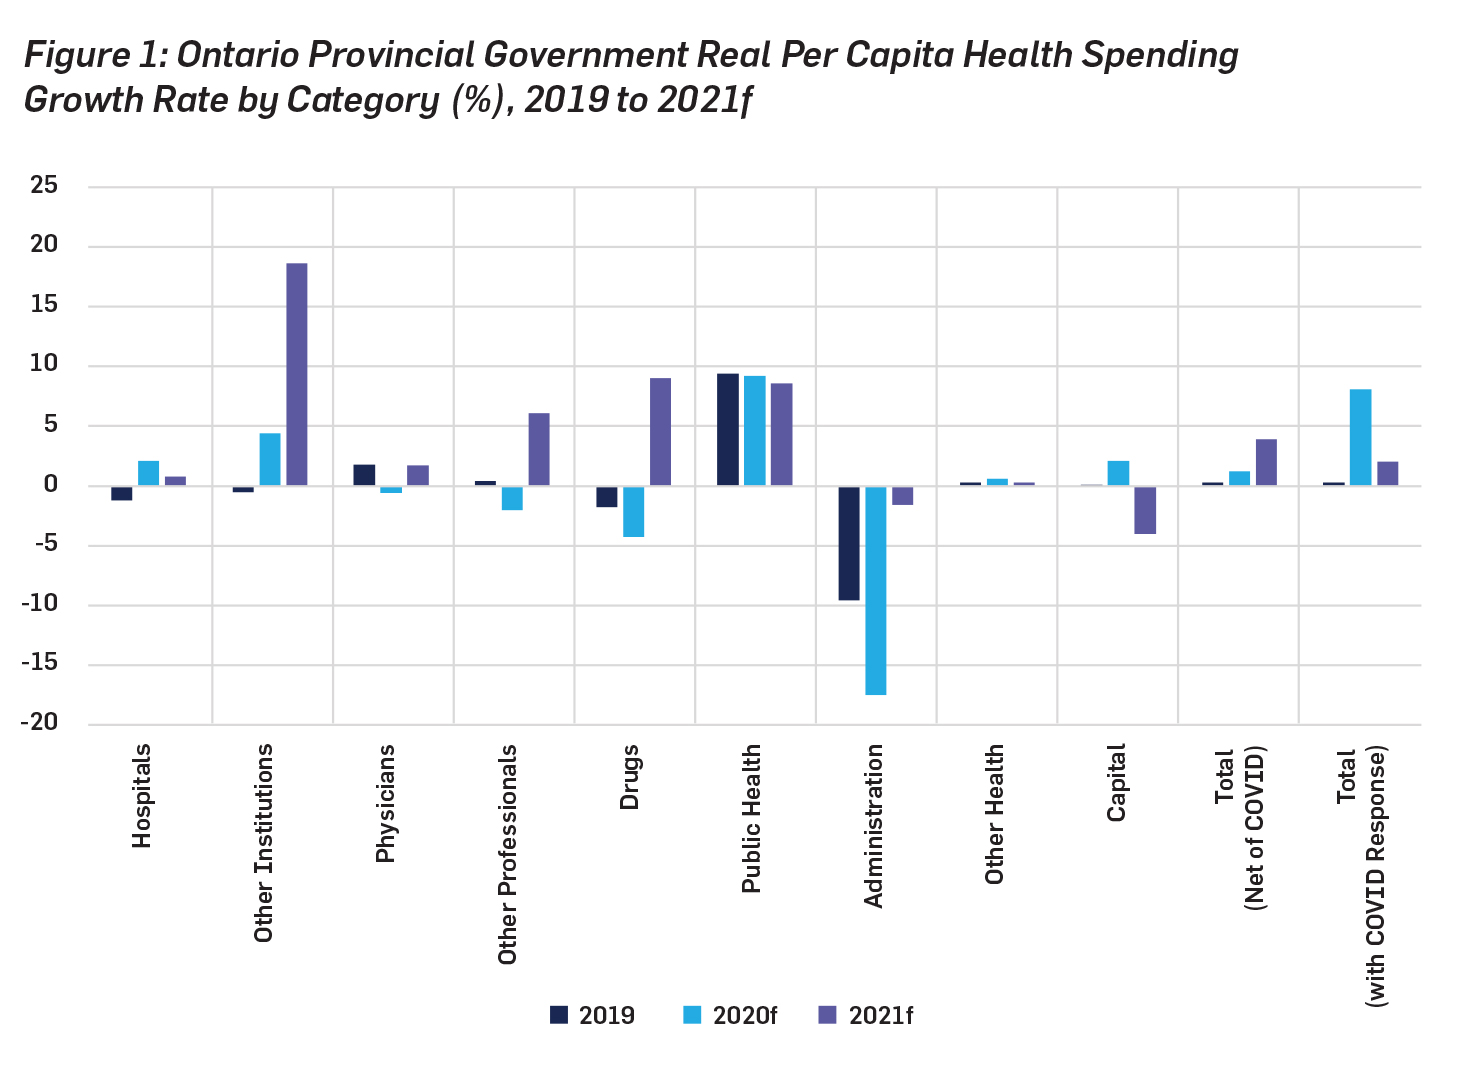
From 2010 to 2019, real per capita provincial government health spending in Ontario rose at an annual average rate of 0.6 percent. This was down substantially from the increases of the first decade of the 21st century which saw real per capita growth rates that averaged approximate 3 percent annually. Thus, the decade prior to the pandemic saw Ontario government health spending restraint which may have contributed to the ability to ramp up pandemic response. With the COVID-19 response funding, real per capita provincial government health spending rose 8 percent in 2020 and is expected to rise 2 percent in 2021 while without this support the increases are factored at 1.2 percent in 2020 and 3.9 percent in 2021. As the accompanying figure illustrates, the increases in real per capita spending in 2020 and 2021 were particularly large in the categories of other institutions (long term care) and public health. On the other hand, provincial government health spending on physicians, other professionals and drugs in real per capita terms declined in 2020 because of disruption and postponement of medical procedures and services due to COVID-19.
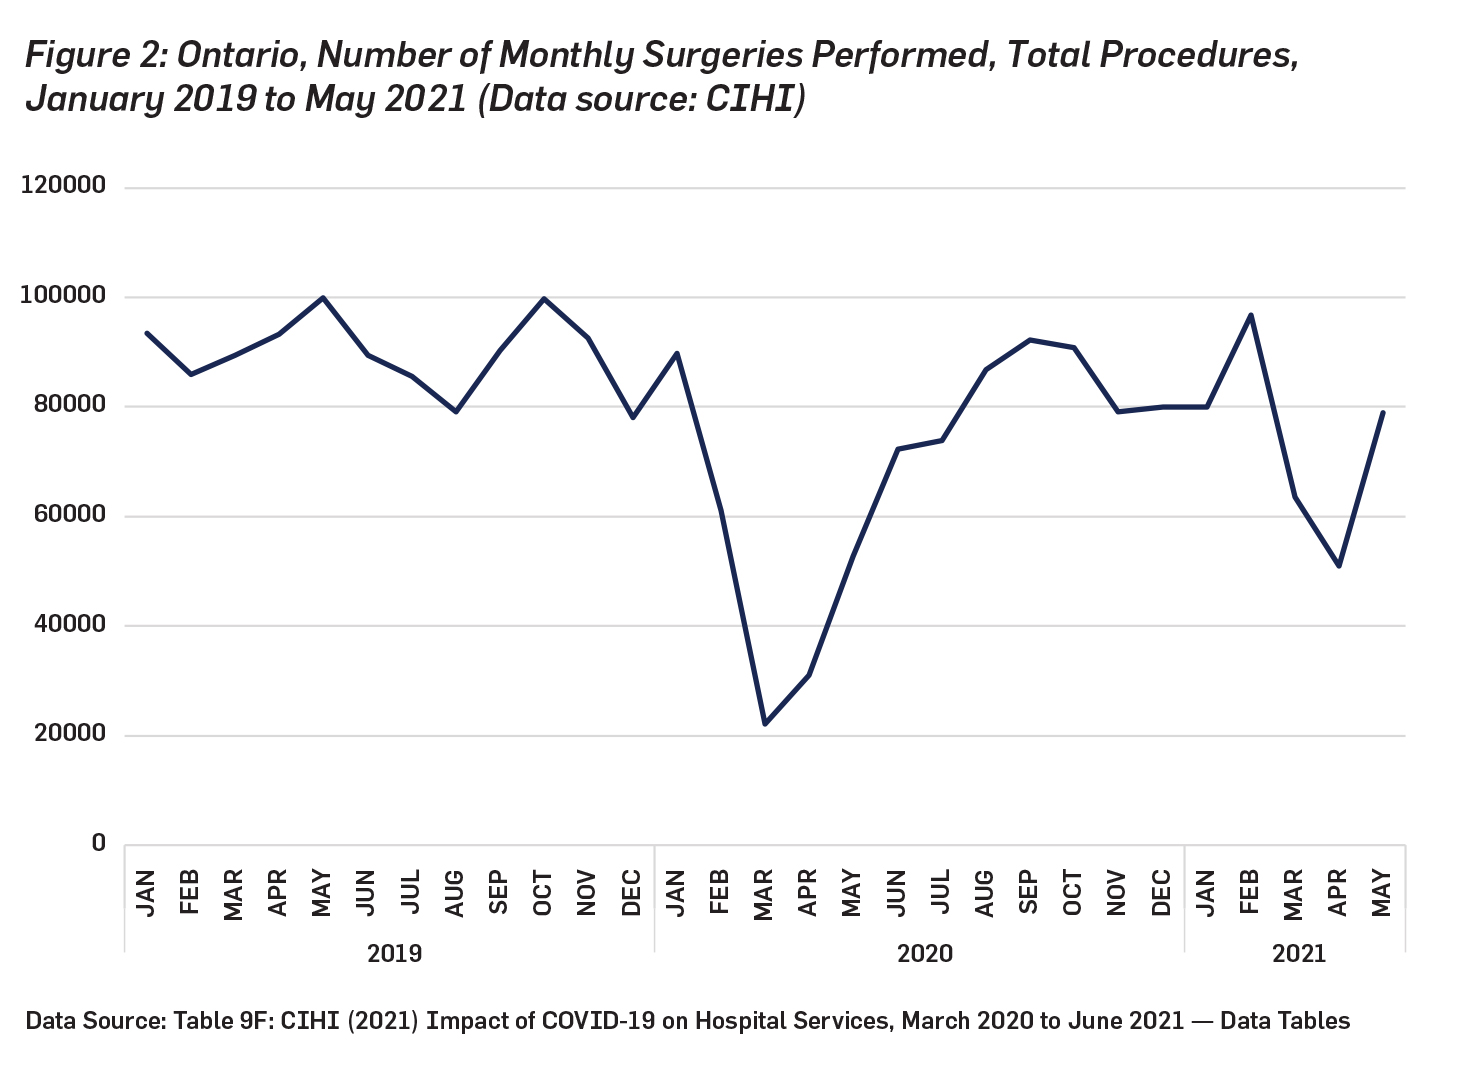
It remains that closure of outpatient departments and postponing of medical visits and procedures during the height of the pandemic reduced many aspects of health service provision and health spending which will have ramifications for years to come. According to CIHI’s own analysis of COVID-19’s effect on Canada’s health care system, from March to December 2020, overall surgery numbers fell 22% compared with the same period in 2019, a drop of 413,000 surgeries. The numbers for Ontario are illustrated in Figure 2 and they show that from January 2020 to March 2020, total monthly surgical procedures performed drop from 89,726 to 22,164 – a decline of 75 percent.[14] While they had recovered to 2019 levels by September of 2020, between February 2021 and April 2021 there was another pandemic induced drop from 96,814 to 51,039 – a drop of nearly 50 percent. In total, compared to 2019, 2020 saw 245,000 fewer surgeries in Ontario.
Finally, along with the pandemics effect on many businesses in Ontario due to lockdowns and other restrictions, there are long-standing issues of weak business capital investment and the subsequent prospects for future economic growth. Productivity growth requires new investment in productive capital—plant, machinery, and equipment—and the last few decades have seen a long-term decline in Ontario’s investment to GDP ratio from highs of nearly 25 percent to approximately 20. A recovery of sorts from lows below 20 percent seems to have started between 2000 and 2010 but much of that was housing investment with real per-capita investment in residential structures recovering, growing at an average of 1.5 per cent annually – growth that nevertheless appears to have not kept up with demand. Meanwhile both non-residential structures and machinery and equipment saw average annual declines at about 2 per cent and .5 per cent respectively. As for the period since 2010 (excluding pandemic year 2020), the province saw real per-capita investment in residential structures growing at an average just below 2 per cent, non-residential structures at nearly 5 per cent with machinery and equipment at under 2 per cent and intellectual property product investment at just over 1 per cent.[15]
To conclude, this brief overview has highlighted areas of challenge facing Ontario’s provincial government as it moves into the post-pandemic era. The challenges facing Ontario’s public finances in the wake of the pandemic are not limited to health and education but are multidimensional cutting across social and economic sectors of the province. There will undoubtedly be vigorous competition and lobbying from these sectors to have their needs addressed.
Fiscal Analysis
According to the 2021 Fiscal Reference Tables, the 2019-20 fiscal year saw total revenues in Ontario of $156.1 billion and total expenditures of $164.8 billion for a deficit of $8.7 billion. According to the autumn 2021 Ontario Economic Outlook and Fiscal Review, in 2020-21 Ontario saw total revenues of $164.9 billion and total expenditures of $181.3 billion for a deficit of $16.4 billion. The current outlook for 2021-22 is expected to see total revenues of $168.6 billion and total expenditures of $190.1 billion for an anticipated deficit of $21.5 billion. Going into 2022-23, revenues are forecast to continue rising to $171.5 billion but total expenditures are forecast to rise only slightly to $191.1 billion for a deficit of $19.6 billion. As for 2023-24, it is forecast to see the deficit fall to $13 billion with revenues rising to $178 billion and expenditures at $191 billion. The projected expenditure trend is curious given the provincial government among other things has been promising new care standards in long-term care as well as construction of more beds that will undoubtedly require more spending.[16]
The two-year period from 2019-20 to 2021-22 saw total provincial government revenues rise by an estimated 8 percent while total spending grew by 15.4 percent. While the pandemic saw an increase in expenditures, in the end provincial revenues did not collapse. Average revenue growth of 4 percent a year is in line with historical average annual revenue growth for the period 1991 to 2021 of 4.2 percent annually. Historically, annual expenditure growth in Ontario over the same period is 4.3 percent. Thus, Ontario’s finances have historically been characterized by steady increases in revenues and expenditures that on average match one another but are punctuated by short-term expenditure increases or revenue drops that have generated large deficits that then take years to reduce.
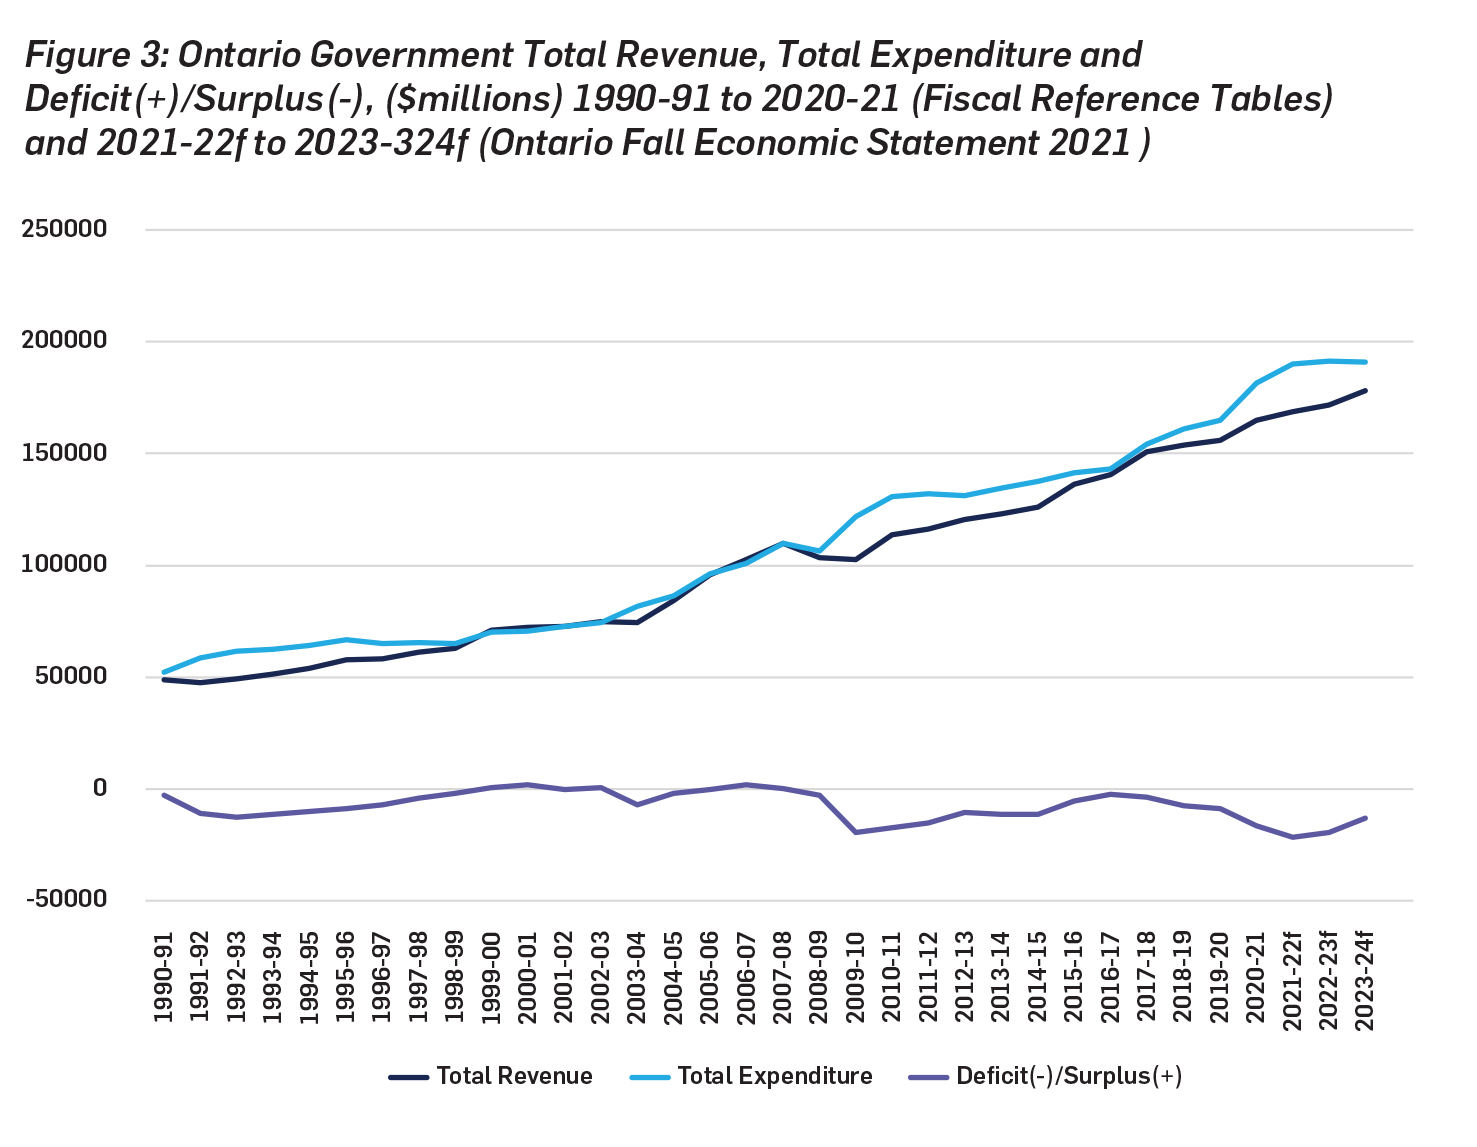
Figure 3 illustrates this by providing a perspective on revenues and expenditures in Ontario since the 1990-91 fiscal year and going forward with recent fall provincial government forecasts to 2023-24. The period from 1990-91 to 2020-21 is data provided by the federal Fiscal Reference Tables, the period from 2021-22 to 2023-24 is estimated data and forecasts from the 2021 Ontario Economic Outlook and Fiscal Review. There were major deficit periods during the early 1990s, early 2000s and then after 2009. Indeed, over the 31-year period from 1990-91 to 2020-21, Ontario ran a deficit 26 times – that is nearly 84 percent of the time. It is expected to continue running deficits in both 2022-23 and 2023-24.[17]
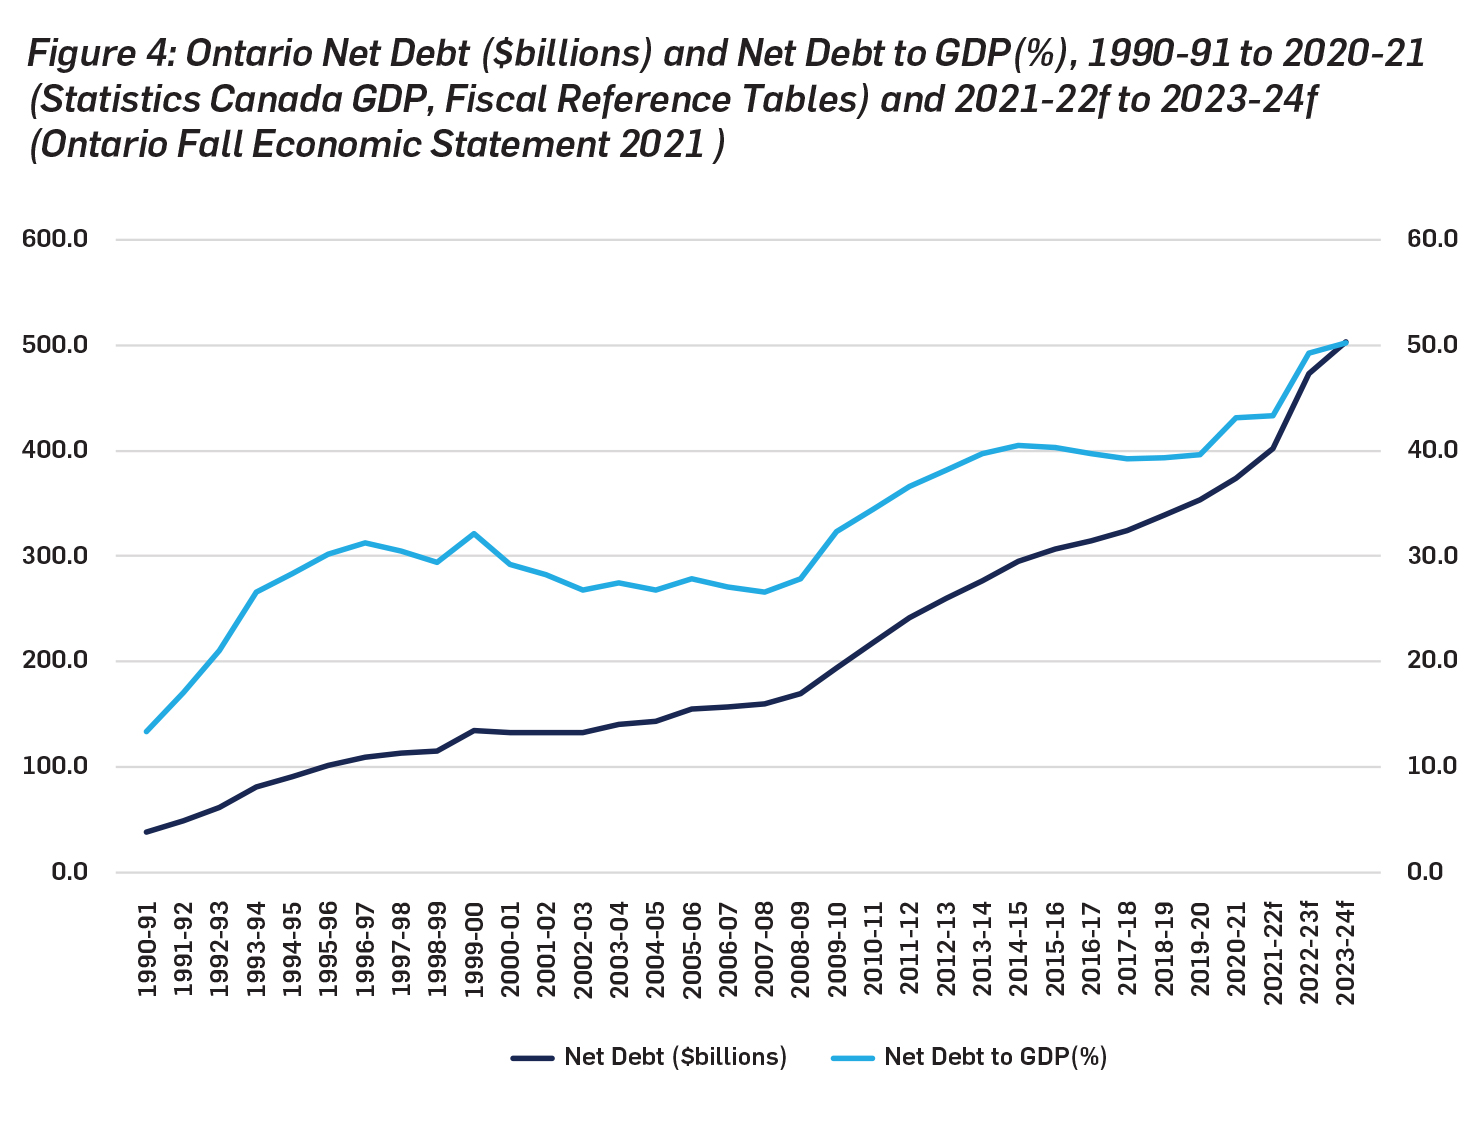
The sum of the shortfalls between revenues and expenditures results in borrowing and this becomes the provincial public debt which once provincial financial assets are subtracted becomes the net debt. Figure 4 plots both the absolute value of Ontario’s net debt since 1990-91 with forecasts to 2023-24 as well as the net debt to GDP ratio. Between 1990-1 and 2020-21, Ontario’s net debt grew from $38.4 billion to $373.6 billion and by 2023-24 in the pandemic’s wake is expected to reach $503.3 billion. As a share of provincial GDP, Ontario net provincial government debt was 13.4 percent in 1990-91 and grew to reach 43.1 percent by 2020-21. According to the longer-term fiscal projections in the spring 2021 provincial budget, net debt to GDP is expected to peak in the mid-2020s at about 51 percent before declining to 46 percent by 2029-30.
A curious feature of Ontario’s public finances is that increases in net debt have often exceeded the deficit. Indeed, over the entire period 1990-91 to 2020-21, the sum of accumulated deficits in Ontario was $206 billion while the increase in net debt was $335 billion- $129 billion more than the sum of the deficits. While some of this might be due to debt service costs particularly during the higher interest environment of the 1990s, much of the difference is due to government accounting practices whereby borrowing for new capital infrastructure projects is added independent of program spending. In other words, the deficit reported in budgets is only an operating deficit and this practice has enabled governments to present much smaller deficits than would be the case if infrastructure spending was charged against the operating budget. The result is an operating budget deficit which is reported, and a capital budget deficit reflected by increases in the net debt (Wen, 2015: 4-9). Such a practice in the end complicates the question of whether Ontario’s public finances are sustainable.
Fiscal sustainability in the end is about simple mathematics.[18] The government budget requires that government program spending plus debt service expenditures must equal government revenues plus the deficit. The dynamics of deficits and debt over the long term are ultimately shaped by the relationship between interest rates (r) and the growth rate of the economy (g). During periods where r > g, deficit financing results in rapid debt accumulation and demonstrates the potential instability of deficit finance. If interest rates exceed growth rates, then government must run a surplus to maintain a constant debt to GDP ratio. If balances fall short, then a “fiscal gap” exists and increases in revenues or decreases in program spending may be required. These dynamics summarize into the following. If r<g, the net debt to GDP ratio will fall, while if r>g, the net debt to GDP ratio will rise. Thus, sustainability in the end means a stable or declining net debt to GDP ratio.
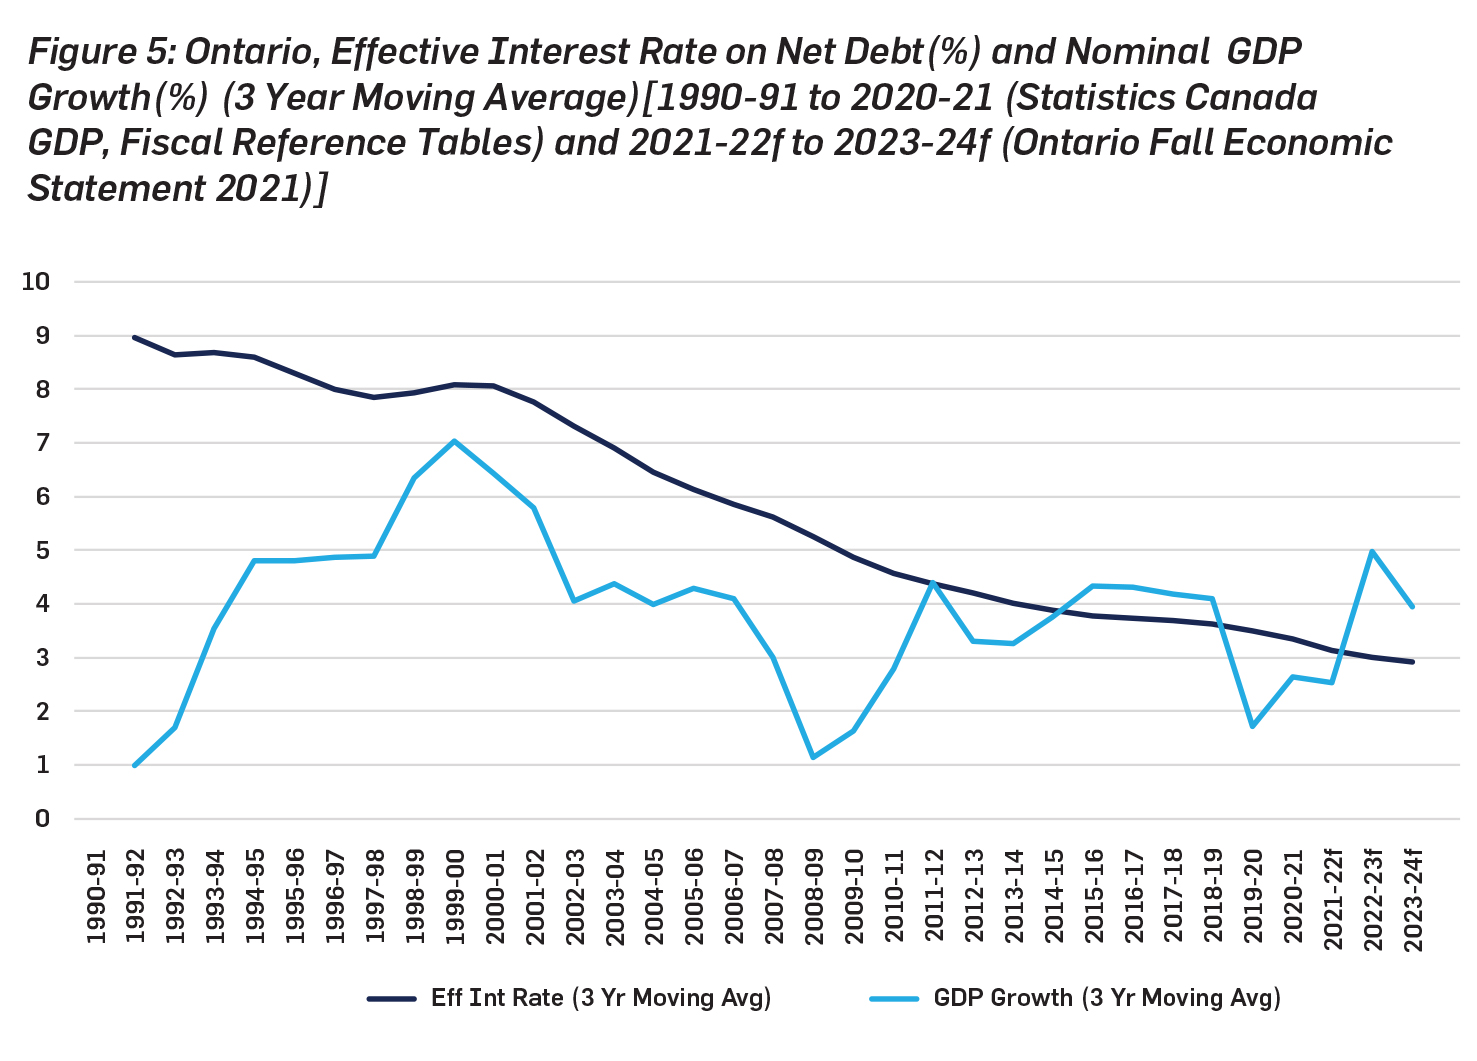
The sustainability of public finances in Ontario have been assisted by declining long-term interest rates on the provincial debt which have gradually brought r closer to g as shown in Figure 5. The effective interest rate on the provincial net debt exceeded the growth rate of GDP for the period stretching from 1990-91 to about 2014-15. While the first two debt surges and subsequent plateaus occurred during periods of r>g, the period since 2015 is marked by r<g. Ontario’s fiscal situation can be perhaps best characterized as sustainable if necessary but not necessarily sustainable. There have been periods of rapid increases in the net debt to GDP ratio – clearly an erosion of fiscal sustainability – followed by periods in which the ratio has stabilized or even declined slightly.
Indeed, there have been three waves of rising debt to GDP burden – the recession era of the early 1990s, the period following the 2007-08 Financial Crisis and Great Recession, and now the current pandemic. While the first two surges were followed by net debt to GDP plateaus marking periods of temporary sustainability, the overall trend is a rising net debt to GDP ratio over a thirty-year period. Ontario essentially has a long-term fiscal sustainability problem that has been postponed by short term periods of relative sustainability. Once the net debt to GDP ratio stabilizes, any sense of urgency fades and a business-as-usual approach to the public finances resumes.
It remains to be seen what will happen as the 2020s unfold in the aftermath of the pandemic. As noted earlier, Ontario faces a range of pressing issues on the economic, social and health fronts which have been exacerbated by the pandemic and which will generate competing demands for government resources not least of which will be in health and long-term care. If during the 2020s, the growth rate of the Ontario economy remains above the effective rate of interest on the net debt, it will be possible for Ontario to continue to run operating deficits and even borrow for capital projects to address some of the issues generated by the pandemic. It will be able to add to its nominal debt and maintain a flat net debt to GDP ratio albeit at the highest level of the last thirty years. In this sense, it will be business as usual in Ontario with the day of fiscal reckoning postponed yet again.
Conclusion
Ontario’s public finances are marked by a long-term trend of rising net debt to GDP indicating long-term unsustainability. At the same time, this trend has been punctuated by periods in which the net debt to GDP has stabilized though at a higher level than before the surge. During this period of short-term sustainability, the urgency of the fiscal situation tends to fade and the process of revenues matching expenditures proceeds at a lower speed. This is further complicated by government accounting practices that have allowed for increases in the net debt more than the operating deficit because of capital spending.
Ontario seems poised to enter another period of short-term fiscal sustainability marked by a flat net debt to GDP ratio in the wake of a debt to GDP surge. Given Ontario’s fiscal history, it is hard not to feel a sense of déjà vu in that this has happened before and may now be about to happen again. Nonetheless, it would appear there will likely be yet another window of opportunity over the remainder of the 2020s that will allow government to both address some of its pressing economic and social issues with new and directed spending while maintaining the net debt to GDP ratio at a constant albeit higher level.
This window will remain open so long as interest rates stay at their historic lows and GDP growth remains robust enough such that it matches or exceeds the effective interest rate on the debt. The quality of government decision making in this period is crucial. If Ontario is going to spend more to address issues that have been flagged or amplified by the pandemic, it is paramount that it prioritizes decisions using a rigorous expert led expenditure review process rather than simply make decisions driven by the short-term clamour of the loudest interest groups. Future windows of opportunity are not guaranteed.
Livio Di Matteo is a Professor of Economics at Lakehead University specializing in public policy, health economics, public finance and economic history.
References
Canada (2021) Fiscal Reference Tables 2021. Department of Finance.
CIHI (2021a) Hospital Beds Staffed and In Operation, 2019–2020.
https://www.cihi.ca/en/cihi-updates-annual-indicators-and-data
CIHI (2021b) National Health Expenditure Trends 2021.
https://www.cihi.ca/en/national-health-expenditure-trends
CIHI (2021c) Impact of COVID-19 on Hospital Services, March 2020 to June 2021 — Data Tables https://www.cihi.ca/en/covid-19-resources/impact-of-covid-19-on-canadas-health-care-systems/download-the-data
Davies, J. (2021) “Economic Inequality and COVID-19 Deaths and Cases in the First Wave: A Cross-Country Analysis,” Canadian Public Policy, 47,4, December, 537-553.
Di Matteo, L., and B. Eisen (2018) Restoring Ontario’s Public Finances. Fraser Institute. https://www.fraserinstitute.org/sites/default/files/restoring-ontarios-public-finances.pdf
Di Matteo, L., and M. Smart (2020) Ontario’s Public finances: Diagnosis and Prescription. Finances of the Nation, November. https://financesofthenation.ca/2020/11/10/ontarios-public-finances-diagnosis-and-prescription/
Di Matteo, L. (2021) Global Storm: The Effects of the COVID-19 Pandemic and Responses around the World. Fraser Institute.
Di Matteo, L. (2021) Ontario needs more business investment during the recovery and beyond. Fraser Institute. https://www.fraserinstitute.org/blogs/ontario-needs-more-business- investment-during-the-recovery-and-beyond
Di Matteo, L. (2018) Fiscal Policy Transition Briefing: Restoring Ontario’s long-term fiscal sustainability. Ontario 360. School of Public Policy and Governance, University of Toronto.
Drummond, Don (2012). “Drummond Report.” Commission on the Reform of Ontario’s Public Services. Queen’s Printer for Ontario. https://www.opsba.org/wp-content/uploads/2021/02/drummondReportFeb1512.pdf
Financial Accountability Office of Ontario [FAO] (2019). Income in Ontario. Growth, Distribution and Mobility. Winter. https://www.fao-on.org/web/default/files/publications/Income%20Jan%202019/Income-report.FAO.pdf
Financial Accountability Office of Ontario [FAO] (2018). Economic and Budget Outlook. Assessing Ontario’s Medium-term Budget Plan. Financial Accountability Office of Ontario. https://www.fao-on.org/en/Blog/Publications/EBO-spr-18
Gallagher-McKay, Kelly, Prachi Srivastava, Kathryn Underwood, Elizabeth Dhuey, Lance McCready, Karen B. Born, Antonina Maltsev, Anna Perkhun, Robert Steiner, Kali Barrett, Beate Sander on behalf of the Ontario COVID-19 Science Advisory Table (2021) COVID-19 and Education Disruption in Ontario: Emerging Evidence on Impacts. Science Table. COVID-19 Advisory for Ontario. https://covid19-sciencetable.ca/wp-content/uploads/2021/06/Science-Brief_Education_v.1.1_20210616_published.pdf
OECD (2021) Health Statistics. https://www.oecd.org/health/health-data.htm
Office of the Auditor General of Ontario (2017). Annual Report 2017. Vols. 1 and 2. Auditor General of Ontario.
http://www.auditor.on.ca/en/content/annualreports/arbyyear/ar2017.html
Office of the Parliamentary Budget Officer (2018) Fiscal Sustainability Report 2018. Ottawa. https://www.pbo-dpb.gc.ca/web/default/files/Documents/Reports/2018/FSR%20Sept%202018/FSR_2018_25SEP2018_EN_2.pdf
Office of the Parliamentary Budget Officer (2021) Fiscal Sustainability Report 2021. Ottawa. https://www.pbo-dpb.gc.ca/en/blog/news/RP-2122-010-S-fiscal-sustainability-report-2021-rapport-viabilite-financiere-2021
Ontario (2020) Ontario’s Action Plan. 2020 Ontario budget. The honourable Rod Phillips. Minister of Finance.
Ontario (2021) 2021 Ontario Economic Outlook and Fiscal Review Build Ontario. The Honourable Peter Bethlenfalvy, Minister of Finance.
Public Health Ontario (2022) DAILY EPIDEMIOLOGICAL SUMMARY COVID-19 in Ontario: January 15, 2020, to January 13, 2022.
https://files.ontario.ca/moh-covid-19-report-en-2022-01-14.pdf
Robinson, Tranjan and Oliveira (2021) Poverty in the Midst of Plenty. Canadian Centre for Policy Alternatives. November. https://www.policyalternatives.ca/sites/default/files/uploads/publications/Ontario%20Office/2021/11/Poverty%20in%20the%20midst%20of%20plenty%20EN_FINAL.pdf
Scotiabank. Global Economics. (2022) Housing Note.
https://www.scotiabank.com/ca/en/about/economics/economics-publications/post.other-publications.housing.housing-note.housing-note-january-12-2022-.html
Tombe, T. (2020) Provincial Debt Sustainability in Canada: Demographics, Federal Transfers, and COVID-19. Canadian Tax Journal, 68(4), 1083-1122.
https://financesofthenation.ca/2021/01/22/provincial-debt-sustainability-in-canada-demographics-federal-transfers-and-covid-19/
Wen, J.F. (2015) Ontario’s Debt Balloon: Source and sustainability. Fraser Institute.
[1] For some overviews of the first phases of the COVID-19 pandemic, see Di Matteo (2021) and Davies (2021).
[2] Public Health Ontario (2021).
[3] See for example Drummond (2012), Di Matteo (2018,) Di Matteo and Eisen (2018) and Di Matteo and Smart (2020).
[4] See for example Financial Accountability Office (2018), Office of the Auditor General (2017) and Office of the Parliamentary Budget Officer (2017).
[5] The PBO defines sustainability as: “PBO assesses fiscal sustainability using the fiscal gap—the difference between current fiscal policy and a policy that is sustainable over the long term. The fiscal gap represents the immediate and permanent change in revenues, program spending, or combination of both, expressed as a share of GDP, that is required to stabilize a government’s net debt-to-GDP ratio at its current level over the long term.” Office of the Parliamentary Budget Officer (2021: 2).
[6] Office of the Parliamentary Budget Officer (2021).
[7] Gallagher-Mackay et al., (2021).
[8] Author’s calculation. Data Source: Housing Price Index. Teranet and National Bank of Canada. https://housepriceindex.ca/#maps=c11
[9] Scotiabank (2022).
[10] See: Canadian Rent Report (2022) Zumper https://www.zumper.com/blog/rental-price-data-canada/
[11] Robinson, Tranjan, and Oliveira (2021).
[12] Financial Accountability Office (2019).
[13] Di Matteo (2021: 52).
[14] Data Source: CIHI (2021c).
[15] Di Matteo (2021).
[16] In Fall of 2021, the government announced billions of dollars more to train and hire staff in long-term care as well as a commitment to build 30,000 new beds by 2028 while January of 2022 has seen announcements of new hospital beds and health workforce expansion. For example, see: https://news.ontario.ca/en/release/1001060/ontario-introducing-new-legislation-to-fix-long-term-care; https://news.ontario.ca/en/release/1001411/ontario-continues-to-add-hospital-beds-and-build-up-health-workforce
[17] It should be noted that going forward to 2029-30, Ontario in the spring 2021 budget also forecast continuing deficits in each year. Given that Ontario last balanced its budget in 2007-08, if these projected deficits all come to pass, Ontario will have incurred 22 consecutive deficits by 2029-30 making it the longest string of consecutive deficits since the mid 1960s.
[18] Tombe (2020)