Policy Papers
How to Improve Ontario Energy Forecasting
This report examines ideas raised by a virtual roundtable of energy experts, providing a deeper analysis of how the Ontario government and the Independent Electricity System Operator make use of energy forecasting in their decision-making; and what insights can be learned from other sectors, models and jurisdictions.
By George Vegh[1], Ian T. D. Thomson
Issue Statement
In March 2021, Ontario 360 convened a virtual roundtable of energy experts to discuss long-term energy system planning.[2] This roundtable was in response to the government soliciting input on how to refocus the current energy planning process, with the stated goals to “promote transparency, accountability, and effectiveness of energy planning decision-making, increase investment certainty, and ensure the interests of ratepayers are protected.”[3] While the roundtable discussion touched on many ideas related to integrated planning and the role of politicians and energy experts, participants also discussed the role of energy forecasting in the planning process and the desire for more robust and accurate forecasting as the basis for energy procurement.
In this discussion, some participants were noticeably critical of forecasting in Ontario, viewing the exercise as an area of “striking weakness” in provincial planning.[4] They noted challenges the province has faced due to inaccurate forecasts guiding substantial generation procurement; and how such inaccuracies have significant downstream effects for the province’s energy planning. Participants also suggested a need for greater expertise and more enhanced external review and stress testing in energy forecasting. This included the use of either the Ontario Energy Board (OEB) or third parties to test and challenge the forecasting assumptions. A more accurate, robust outlook could follow in helping to guide decision-makers and the province’s long-term energy planning.
Since the roundtable, there have been some internal changes regarding provincial energy policy. Most notable is a new Minister of Energy, Todd Smith, and the return of a sole Ministry of Energy as of mid-July.[5] For the last few years under Minister Greg Rickford, the Ministry of Energy had been merged with the Ministry of Northern Development and Mines.
As the new minister develops a long-term energy plan for the province, opportunities exist to address and enhance electricity planning and decision-making, and the forecasts behind them. Having accurate, stress-tested forecasts are not just for internal policy decision-making by government; such forecasts are also relied upon by many critical stakeholders and businesses which are key parts of Ontario’s $20B energy sector.[6]
This report examines more closely ideas raised at the roundtable discussion, as well as provides a deeper analysis of how the Ontario government and the Independent Electricity System Operator (IESO; which produces Ontario’s energy forecasts) make use of energy forecasting in their decision-making; and what insights can be learned from other sectors, models and jurisdictions. Specifically, it looks to address three issues:
- How should decision-makers analyze energy forecasts generally? What contextual factors and paradigms should they be aware of when examining energy forecasts?
- What is the quality of forecasting in Ontario specifically? Are experts correct in calling energy forecasting an area of “striking weakness”?
- What insights can be gleaned from other models/sectors/jurisdictions to enhance Ontario’s energy forecasting?
Section 1: Forecasting Overview
To begin, decision-makers should be aware of core fundamentals that make up energy forecasting.
1.1 What is Forecasting and Why is it Important?
Forecasting, at its core, involves anticipating features of the future. This often involves both forecasting future demand and anticipating future supply, to ensure that the necessary actions are taken to provide for sufficient and reliable resources under a short, medium, and long-term timeframe. Such forecasting occurs in essentially all industries to various extents and magnitudes; as Hong and Shahidehpour (2015) observes, airlines need to anticipate the number of passengers to schedule flights and the brewery industry must project future beer consumption to plan production.[7]
In the energy sector, different forecasts exist for different reasons. In electricity, most dominant is load forecasting, which refers to the outlook for electricity demand and energy along all facets of generation, transmission, distribution, and retail sales. A key element of the electricity sector is that, due to uneconomic battery storage, energy needs to be generated and distributed at the exact moment it is needed. This necessitates that supply has to be equal to demand at all times and into the future. Thus, in addition to predicting future consumption, forecasters also must anticipate how much of the existing capacity will be available to ensure reliability and meet anticipated demand, making judgements on procured contracts and market dynamics.
Forecasting’s role is to predict (as accurately as possible) how much electricity demand is anticipated in the timeframe specified, how much supply is anticipated to be available to meet that demand in the timeframe specified, and what decisions need to be taken regarding generation, transmission and distribution to close the gap between the two.
If forecasts are meant as the basis for decision-making, then precision is critical. An inaccurate outlook can lead to either over-forecasting or under-forecasting of either electricity demand or supply. By under-forecasting demand, a jurisdiction may not have the adequate electricity supply to meet the needs of consumers. This could lead to measures to cope with over-demand or insufficient supply of the type seen in Ontario and California in the early 2000s. Conversely, if demand is over-forecasted, this may lead to greater investment than needed. New generation, new transmission lines and increased capacity may lead to a more reliable network (i.e., one will always have electricity), but will come with more costs to the utility, which then trickle down to the ratepayer.[8]
From here, the importance of the forecast varies from stakeholder to stakeholder. For the electricity planner, whether a central planner, or a government-owned or privately-owned utility, inaccurate prognostications affect the strategies for their energy planning. Medium-to-long- term decisions over capital-intensive projects and justifications for their electricity rates are often made with these calculations in mind. Thus, an inaccurate forecast can lead to unnecessary projects being built on the grid, and burdensome costs to either the utility (which could lead to bankruptcy)[9] or ratepayers, affecting the bottom line for families and small businesses which may not be able to make ends meet.
Furthermore, governments may make critical public policy decisions related to energy efficiency and conservation, distributed energy resources or support of specific energy/electricity sources based on what may happen in the future. Conservation measures, so that those on the grid are incentivized to not use energy, may be more or less useful depending on whether the affected area will have an electricity deficit or surplus in the future. Thus, a policy may not have the desired effect if it is not based on what may actually happen in the future.
Lastly, because the plan and the forecast are intrinsically linked, such that the plan influences the forecast and vice versa, one inaccurate forecast could conceivably lead to a cycle of poor planning. Such a scenario is examined within the B.C. context in section three. As such, forecasting processes and the inputs that make up the forecasts should be constantly tested to ensure that those in the sector have an accurate assessment of what the future may hold.
1.2 What Leads to an Inaccurate Forecast?
Forecasting is an inherently difficult task. This stems from the fact that, in forecasting, one is trying to predict the future, which is of course uncertain. Thus, many forecasters continuously acknowledge the uncertainty when publishing their outlooks.[10] As Hong et al. (2015) notes, there will always be differences between a forecast and what the actual outcome will be.[11]
There are several reasons why a forecast varies from the later observed reality. These include bad aggregate data in the model, inappropriate methodology taken by the forecasters, less than optimal inputs/ metrics placed into the model or the same regarding the values and assumptions behind them.[12] This is further complicated by the governance and culture of the institution making the forecast, what the projection is actually used for, and the biases held by both humans generally and the experts that develop forecasts specifically. This is then multiplied by the timeframe: outlooks produced can be “very short term” (a few minutes or an hour ahead of forecasting); short-term (one day to two weeks ahead); medium term (two weeks to three years ahead) and long- term (three to fifty years ahead).[13],[14]
It is not possible in this document to review every possible flaw in the process.[15] However, the following are the most salient issues that may contribute to inaccuracy.
1.3 Inputs
One key area are the inputs to the model. These have changed and become more complicated over time. For instance, in the late 1800s and early 1900s, lighting was the sole use of electricity, and thus forecasting was relatively easy: “the power companies could just count how many light bulbs they installed and planned to install.”[16] However, as electricity became the source for industry productivity and for household items broadly, and how information and entertainment is disseminated, forecasting become a lot less “non-trivial.”[17]
Currently, several inputs go into a forecasting model. These metrics are related to economic and population growth and shifts in sector and geography, technological changes, environmental considerations, consumer preferences and various price elasticities tied to the cost of electricity and alternative energy, among others. In electricity demand forecasting, the inputs and their breakdowns are often observed across three sectors: residential, commercial and industrial.[18]
Many of these variables are, on their surface, intuitive and sometimes easy to calculate if given sufficient data. In the case of electricity for the residential sector, variables such as expected population growth over time and how many people will be on the electricity grid make sense to incorporate into a demand forecast. In the commercial sector, variables such as floor space have been shown to have an historically tight correlation to electricity demand.[19] For instance, ICF International Consulting examined how, from 1990 to 2005, electricity demand in Ontario grew 1.72 percent per year and commercial floor space grew at 1.75 percent per year, showing how the two track very closely.[20]
However, many variables and their relation to future energy demand and supply require extensive analysis and expertise to understand. For instance, forecasters have been faced with a decoupling of economic output and electricity demand in some ways. Intuitively, with greater economic prosperity comes more electricity use as people accumulate more wealth and thus purchase more possessions and businesses expand. However, conversely, as a jurisdiction becomes more prosperous and metrics like GDP rise, so too does an ability to be more efficient with the use of electricity, through grid upgrades and conservation measures.[21] Such decoupling occurred in Ontario from the 1990s to 2005 or so, where there was economic growth yet stagnant electricity demand.[22]
Further, many of these variables are subject to much debate in the sector and often seem prone to as much opinion as fact. Conservation measures and the extent to which they can address energy demand is one example; opinion varies based on who may envisage a reduction in energy use.[23] Experts have disagreed on everything from residential electricity appliance use to the price elasticity of electricity rates.[24] Sometimes stress-testing is not possible at all if the forecaster is unclear over what metrics and assumptions are made and incorporated into the forecast. Such criticisms continue to exist in the Ontario context.[25]
It appears that no metric, barring perhaps the most tangible factors and projects, seems off limits to debate, stress testing and judgment. Given the difficulty in determining many of these variables, debate and routine adjustments should be encouraged to enhance and fine-tune the data and inputs of a forecast. Additionally, with all of these metrics, even the smallest of adjustments can lead to large-scale changes in the outcome of a forecast. A forecaster needs to ensure to the best extent possible that there is analytical capacity such that determinations can be viewed as reasonable.
1.4 Biases
Psychological and external biases also play a role in how humans predict the future. Research has shown that people possess certain pre-dispositions and basic perspectives on how they think about the present, as well as the future. Some of these biases are inherently wrong and need to be tempered. This report sets out a few and particularly how they relate to forecasting:
- Experts’ predictive powers, and overconfidence: Forecasts are conducted by highly educated technical experts. However, studies have shown that experts may not be any more accurate at predicting the future compared to a well-informed observer. Research by Princeton psychologist Daniel Kahneman among others has examined the predictive powers of experts. It found that not only are experts not any better than non-specialists, but they also possess a “fatal overconfidence in their own conclusions.”[26] This “overconfidence effect” has been studied by psychologists with reference to the predictions of economists, stemming from the differences between what people really know, and what they think they know.[27] In the case of experts, their professional status make them more committed to their predictions and less willing to change their positions. This can lead to significant consequences. As one expert writes, “[i]f asked to forecast oil prices in five years’ time, an economics professor will be as wide of the mark as a zookeeper will. However, the professor will offer his forecast with certitude.”[28]
Ultimately, if such forecasts repeatedly and dramatically fail, public trust is undermined; as Angner writes, it is then “understandable if economist- expert advice ultimately tends to be discounted or ignored.”[29]
Thus, energy forecasters, as experts, can succumb to such overconfidence in their predictions. An awareness and a humility must guide their work. - The recency bias, “mood of the moment”, and herd instinct: Recency bias refers to the tendency to remember more recent events and observations as opposed to historic ones or even potential future unknown events.[30] In forecasting literature, this effect is observed with regard to historical weather patterns and lagging temperature variables in energy demand forecasts,[31] but the bias can also be evident more broadly among forecasters.Vaclav Smil, in his 2003 book “Energy at the Crossroads”, extensively analyzed how both patterns of the recent past as well as aspirations and trends of the day dominate medium term and long-term forecasting. For instance, he explores the “excessive faith in the practical potential of new techniques” and the “nuclear mania” observed in the mid-20th century.[32] Nuclear power development began in the 1940s and 50s. Experts predicted how, by 2000, nuclear fission would generate nearly all the electricity for households and industry and shape how society functions; as one Nobel prize winner professed at the time, “the vigorous development of nuclear power is not a matter of choice, but of necessity.”[33] Forecasters foresaw an increasingly nuclear world, where energy was derived from large reactors. Large scale reactors in the U.S. and Europe were announced based on the confidence held, there was not “much doubt that a nuclear breeder will be successful.” However, as we know, in reality, nuclear mania was largely abandoned by the late 1970s.[34]
Thus, forecasters and energy experts, much like fashion or art, can succumb to the trends of the time. They also possess consequential biases that affect their decision-making and, ultimately, the reliability of the forecast. Attempts should be made to address these biases through the incorporation of other perspectives.
1.5 Culture, Institutional Biases and Overestimation in Forecasting
These biases and psychological effects are also complicated by the governance and culture of the institution making the forecast, what the purpose of the outlook is, and the level and perception of risk by those who develop the predictions. In most energy-related examples, this leads to an overestimation of electricity demand.
When a utility conducts a forecast, the Averch-Johnson effect may occur. This effect outlines how firms subject to rate-of- return regulation will over-invest in capital “if the allowed return is greater than the required return on capital.”[35] Utilities thus procure greater capital and supply than is needed. This over-investment involves several assumptions, including with regard to energy demand. Studies have shown that U.S. private utilities over a period of time have consistently and regularly overestimated as such. In Carvallo et al. (2018), the researchers analyzed the load forecasting models and performance of 12 utilities in western U.S. states in the early 2000s, showing that most overestimated both energy consumption and peak demand growth.[36] This was also seen in B.C. with the Site C Hydro project; the government-owned utility ostensibly overestimated electricity demand, which was an important input toward construction of the project.[37]
If the forecasting is conducted by a government agency or department, its organizational culture and bias often resides in the perception of its mandate, its proximity to government decision- makers and ultimately, its independence from undue influence. A governmental agency removed from political and ministerial oversight is theoretically less influenced by policy outcomes when crafting its forecasts; conversely, an agency with less operational independence from government may be more influenced by the desired outcomes of government, including specific electricity procurement. Further, the agency may not address or come to certain conclusions on controversial policy matters in the forecast, depending on the government of the day. Such incorporations, even when politically uncomfortable, may in fact be necessary to produce a more accurate portrayal of the future. For instance, in reviewing the degree of accuracy of forecasting by the Department of Finance, O’Neill found that one of the primary reasons for consistent underestimation of budget surpluses was the government’s “no-deficits” rule.[38] This rule, despite not being formally legislated, was adhered to strenuously, and created incentives for civil servant forecasters to incorporate extra implicit prudence into the forecasts. O’Neill notes the following:
“If the officials responsible for producing forecasts are faced with an unequivocal commitment on the part of the government that no deficit will be tolerated, no matter how small and irrespective of the economic circumstances, there will be inevitable behavioural consequences. When considering a range of possible outcomes for a revenue or expenditure item, the prudent civil servant will tend to pick a point estimate at the low end of the range for revenues and at the high end for expenditures. There is nothing sinister or underhanded about such behaviour.” [39]
In Ontario, concern has been raised over the lack of independence held by the province’s ostensibly independent agencies, particularly in respect to the government’s green energy push and the extensive use of ministerial directives towards these agencies in the mid-2000s.[40] While there have since been calls to enhance these expert agencies,[41] the IESO, which conducts the forecasts, is still ultimately a creature of government and accountable through the Minister of Energy. Indeed, informal interviews for this report seemed to indicate that the IESO remains in close contact with the government. Such a relationship may also affect how transparent it chooses to be with its forecasts. Even as the IESO shares its forecasting data, we still do not know how much guidance and information it receives from government and how it might influence such forecasts.
One last area: the asymmetry of risk. An underestimation of demand will lead to rolling blackouts to address the under- supply, while an overestimation of demand may lead to over-supply and ultimately higher electricity rates to pay for it. To address this asymmetric risk, provisions often exist to prevent undersupply and blackouts, such as reserve requirements. However, from a political perspective, forecasters should be more biased to over- estimate than to under-estimate demand, in an attempt to minimize controversy, as seen in Texas earlier in 2021.[42] Thus, in observing an electricity demand forecast, there is a good probability that it is an overestimate of what the demand will actually be.
In aiming to address inaccurate forecasting, decision-makers need to account for the bias of who is making the forecast in the first place and how they might be incentivized to push the outlook in one direction or the other. In some instances, decision-makers are aware of and mitigate such bias. For example, in adjusting for the Averch-Johnson effect held by utilities, the OEB inspects and has to approve the forecasting model and methodology for provincial utilities. When examining whether the forecasting and inputs are appropriate, it is not unusual for the OEB to discount a utility’s forecasted capital expenditures by up to ten percent. While all forecasting is difficult, this regulatory process, which accounts for biases, is intuitively attractive and allows us to place greater faith in the utility’s adjusted forecast.
However, this regulatory response does not extend to the IESO’s forecasting. In fact, the IESO and the OEB seem to see themselves more as colleagues than as a utility and regulatory body, as evidenced by partnership in innovation funding.[43] Thus, the biases of the IESO’s forecasting held by the government agency remain unaddressed and untested. This is discussed further in section two.
1.6 Incorporation of Public Policy
Forecasting is certainly impacted by public policy decisions taken by federal, provincial and municipal governments. Decisions to address such policy areas as climate change, energy efficiency, and electric vehicle uptake play a role in how a forecast is produced and developed. Yet it is quite difficult to incorporate appropriately policy into forecasting for a number of reasons.
First, governments can be opaque in their decision-making and unclear and sometimes contradictory in their positions. Often, it is quite intentional for a government not to have a position in a particular policy area. For instance, in Ontario, it is currently unclear what the government position is with regard to some of the previously procured energy contracts set to expire in the near future. Such uncertainty has created further confusion over their incorporation in the current forecasting.[44]
Second: the speed and uncertainty of public policy. While political short-termism is a feature of the Canadian Westminster model, decisions taken suddenly can still come as unexpected if the forecaster has not adequately anticipated the policy, or purposefully accounted for policies that could occur. For instance, the IESO has noted that its future electricity demand forecast for electric vehicles will have to be adjusted, given greater interest in electrification expressed since its December 2020 forecast.[45] Using the metaphor of hockey, does a forecaster watch where the puck is (i.e., where government policy currently is or has been announced) or where it is going (i.e., where government policy is going given political and societal trends)?
How this is handled depends to some extent on the mandate of the forecasting body itself. A forecasting body may be explicit about the policies (both present and future) that have been incorporated into a model, while others may see their mandate as simply to provide an outcome based on the policies that are clearly identified without any speculation on what the policies might be in future. This is also related to how independent the agency feels it can be from the government. For instance, the IESO might have been reluctant to incorporate carbon pricing into its forecasts, particularly while the provincial government was challenging federal carbon pricing policy in court in recent years.[46] The result of this may lead to differences between forecasting and forecasting normatively (i.e., how ought the electricity grid be in the future based on the positions of the government to which the agency is accountable).
Holding government policy static in a forecast may appear to be a cautious, prudent position for a forecaster to take; why attempt to predict policy if the future itself and government specifically is so uncertain? However, we argue that this position is unrealistic and actually quite unreasonable. Returning to the hockey analogy, not only is the forecaster watching where the puck is, it is watching the puck and assuming that puck will remain in the same spot for 20 years. Even the most cautious of governments will bring forth new policies over time. By assuming government policy is at a growth rate of 0, in essence, the practice of forecasting becomes even less useful because you know that the predictions will not be realized. If the goal of forecasting is to be to some degree accurate in future energy predictions, making value judgements on where policy is heading is both necessary as well as a more prudent position to hold.
The challenges of policy incorporation are also further confounded by the transparency of the forecast. Lack of transparency over policy assumptions may be a feature of the model if the agency is worried about being seen to contradict its government; however, in being less transparent, decision-makers and stakeholders who use the forecast are not given the opportunity to truly question the forecast and the assumptions made. An outlook should grant decision-makers the flexibility to use the information to make their own decisions, rather than be perceived as a dogmatic prescriptive document. This requires an understanding of the assumptions, including uncomfortable policy judgements made.
In summary, forecasting includes challenges with inputs and their application, psychological and culture biases, and the complex incorporation of public policy. These matters all affect the forecast, its accuracy and how much decision-makers may be willing to see it as a valid document to guide critical decisions. This context provides a helpful basis for examining energy forecasting in Ontario more specifically.
Section 2: Forecasting in Ontario
2.1 Ontario Hydro’s Fiascos
As noted in the Ontario 360 roundtable event, Ontario has a bumpy history when it comes to forecasting. Prior to reforms taken in the late 1990s, electricity forecasting was conducted by Ontario Hydro, the province’s vertically integrated monopoly. Established in 1906, the corporation has been characterized as having had an abundance of flaws in its operations, including opaque decision-making, which was largely untethered from the politicians, bureaucracy and the OEB.[47] Not only did the monopoly possess the critical generation and transmission grid infrastructure, but it was also the key forecaster, rate-regulator and procurement body.
However, it is the inaccuracy of its forecasts which drew the most fire and contributed to the kind of reduced legitimacy of provincial forecasting evidenced at the roundtable discussion. The corporation set hefty forecasting goals in the mid-20th century; in the mid-1970s, Ontario Hydro had forecasted that electricity demand would double roughly every ten years.[48] Much of this forecasting was based on some of the same trends and biases referenced previously. The organization was driven by decision-makers including engineers who were catalysts for nuclear expansion.[49] These decision-makers were excited by home grown new technology such as the CANDU reactor as well the desire to bring about provincial energy self-sufficiency, in light of the 1970s OPEC crisis.[50] The outcome, similar to other jurisdictions described by Smil, was “nuclear mania” and more normative and outcome-based forecasting, with a structural skew towards supply of nuclear energy.[51] As Swift and Stewart (2004) explain, the engineers had a “build-it-and-they-will-come” philosophy at Ontario Hydro which led to nuclear capital expansion at the corporation and significant overestimation of electricity demand.[52]
However, such optimistic beliefs would not come to pass. A 1977 forecast for 1997 forecasted a system peak of 57,000 MW with a low/high range of 36,000 MW and 67,000 respectively.[53] The monopoly was confident that the load would be within the range; however, the forecast was “egregiously wrong” and the peak demand in 1997 was 22,000 MW, or roughly 61 percent of the forecasted low range (or 33 percent of the high range).[54]
Such forecasting optimism (or inaccuracies) would continue into the 1980s as Ontario Hydro built up its nuclear fleet supply to meet its substantial projected demand. Over-estimating demand was a clearly held institutional bias driven to some extent by forecasting risk asymmetry, as discussed previously. This is apparent in comments by Ontario Hydro President Milan Nastich in 1984:
“It’s been said before, but it is worth saying again: if there are going to be mistakes in forecasting, then we have a responsibility to ensure that those mistakes are on the side of safety. It is still better, when all is said, to have an oversupply than to have an electricity shortage. Period.” [55]
In the monopoly’s 1989 system plan, enhancements in forecasting macroeconomic methodology were employed allowing for greater specificity of electricity end-use application. The report forecasted lower projected electricity growth than the previous forecasts, but the end result was still the same; the 1989 plan predicted that there was only a 10 percent probability that electricity demand would dip below its lower bound forecasts of 28,700 MW by 2004 and 33,500 MW by 2014.[56] In reality, actual peak demand in 2004 was 25,000 MW.[57] Even its lower bound forecasts significantly overestimated demand.
A few patterns can be identified that parallel the kind of challenges outlined in section one. These include the biases held by the expert engineer forecasters; the influences of trends such as the promise of nuclear technology; the recency effect from growth witnessed in the 1940s and 50s; the consistent overestimation of supply; the lack of accountability and stress testing of assumptions; and ultimately, the inadequacy of normative and outcome-based forecasting.
The consequence of these inaccurate forecasts was that the monopoly overbuilt the grid on faulty demand assumptions. Actual lower-than-forecasted demand increased the average cost to be recovered per unit of power generated, which increased the monopoly’s debt load and led to the corporation requesting a 40 percent rate increase in the middle of a recession.[58] This led to a public outcry and questions about the legitimacy of the monopoly. Such mismanagement was one of the rationales for the electricity restructuring under the Harris government in the late 1990s.[59] Ontarians were still paying for this debt (and the mistakes of these historical forecasts) up until 2018 through the Debt Retirement Charge on their electricity bill.[60]
2.2 Forecasting in the 2000s
At the beginning of the 21st century, following a hiatus of forecasting in the late 1990s and early 2000s, the Ontario Power Authority (OPA) was formed and led the forecast through the Integrated Power System Plan (IPSP).[61] This technical plan, released in 2007, set out a long-term supply and demand forecast and was to be reviewed by the OEB every three years. This was to be done to stress test the plan and forecast to ensure they were economically prudent, amongst other criteria.[62]
The IPSP was beneficial in being more open to stress testing through the OEB. This allowed for transparent submissions and stress testing by both the Board and interested parties. Understanding the inherently imprecise nature of forecasting, the OEB set forth the following question for consideration in reviewing the IPSP: “Do the forecasts relied upon by the OPA in developing the IPSP, and the uncertainties attributed to them, present a reasonable range of future outcomes for planning purposes?”[63] This model, where the OEB stress tests the IPSP, was short-lived and replaced by ministerial planning through the Long-Term Energy Plan (LTEP).
Both the IPSP and the subsequent iterations of the LTEP had flaws in forecasting predictions and methodology. First, the 2007 IPSP and subsequent 2010 and 2013 LTEPs continued to overestimate demand. There were also significant alterations of the projections between the plans. For instance, 2027 forecasted demand was reduced between plans by an amount equal to almost half of the province’s total nuclear fleet.[64] Additionally, the actual 2012 demand was 2,500 MW off from the 2007 forecast, again demonstrating difficulties with even short- term predictions.[65] As one of the authors has previously observed, such difficulty in forecasting demand even over a short period means that resource decisions based on such forecasts are “high-risk activity.”[66]
Furthermore, some of the criticisms by stakeholders drew on assumptions and judgements made by the forecasters, including in the context of a general lack of clarity. ICF Consulting was one of many witnesses at the OEB’s review of the IPSP on behalf of environmental groups, including Greenpeace and the Pembina Institute. The consultants identified issues related to the use of outdated data, lack of corresponding economic growth projections, inconsistency with expected technological trends (such as not incorporating federal policy related to incandescent lighting phaseout) and a lack of supporting analysis and clarity over the forecasted growth of electricity consumption of per household electricity use.[67] The witnesses also highlighted how the plan predicted demand growth, despite the fact that demand had been falling for decades; the forecast diverged from actual demand trends known at the time. ICF Consulting stated the following:
“…the load forecast underpinning the IPSP follows in the tradition of the previous load forecasts we have referred to above, which have acknowledged the historical decline in electricity demand growth rates but then go on to assume (or to adopt assumptions that lead to the conclusion) that the decline will stop more-or-less immediately in the forecast year and even reverse and begin climbing again over the forecast period.” [68]
However, by having to be approved by the OEB, the IPSP opened itself up to greater formal scrutiny such as the above, being stress tested at an adjudicative tribunal. Stakeholders across the energy spectrum brought forth their arguments related to the forecasting methodologies with disagreements over the reasonableness of the forecast generally and the assumptions that underpinned it.[69] In comparison, neither the LTEP nor the accompanying technical plan were subject to review by the OEB, leaving outside analysis exclusively to third-parties, and within the consultation preceding the plan’s release. The LTEP was certainly not above such criticism; in addition to continuing to over-estimate demand, data and information from the 2013 LTEP regarding how conservation was incorporated into the load forecast was confusing and lacking:[70]
“Forecasting demand is challenging enough: forecasting how demand may be reduced by attributing a portion of that non-consumption to conservation, as opposed to economic decline or deindustrialization, is even more challenging.”[71]
The shift to the LTEP and the IESO’s technical plan (which was to be produced to inform the plan) were, until only recently, the main forecasts for the province. In 2016, in response to the government’s decarbonization initiatives and at the request of government, the IESO produced a 20-year electricity demand forecast using four scenarios ranging from a 9 percent demand reduction to a 68 percent demand increase.[72] These scenarios were based on the extent that gas heat would be replaced by electrical heat, and electric vehicle uptake based on government targets. Interestingly, as discussed in a previous Ontario 360 paper, the IESO “did not even try to forecast what was actually going to occur on the electrification front.”[73] Rather, the agency only provided a range of consumption levels, leaving the choice to government over its preferred scenario forecast to guide its preferred, pre-determined outcome.[74] In essence, this forecast was a lobbying document or “policy-based evidence” (as opposed to evidence-based policy).
2.3 The IESO’s Annual Planning Outlook
Uncertainty resides over the future of the LTEP and the subsequent technical plan produced by the IESO. While the former is under review by the current government, the province’s long-term energy forecast outlook is currently published under the IESO’s Annual Planning Outlook (APO). This document, which initially began in 2018 as a planning presentation, has gone through three versions, the latest being released in December 2020. The APO “provides a long-term demand forecast, and an assessment of whether resources will be ready and sufficient to meet that demand.”[75]
The objective of the APO came in response to criticism in recent years regarding the lack of transparency of forecasting within previous reports and plans. Further, the APO is not at the request of the government, compared to Long-Term Energy Plan’s technical plan. With the APO, the IESO essentially puts everything it knows on the table, allowing decision- makers and stakeholders to access and engage with the forecast as their mandates require. For instance, the APO has been an input into the long-term energy planning processes recently conducted by the government. As stated in the latest report: “The APO is intended to provide market participants with the data and analyses they need to make informed decisions, and communicate valuable information to policy-makers and others interested in learning more about the developments shaping Ontario’s electricity system.”[76]
The goals of the APO to provide greater transparency and openness are noticeable and worth encouraging. Upon examination, the IESO provides data and supplementary information in regards to the methodology and the components that make up forecasted demand, resource adequacy and transmission security. Further, the IESO engages regularly with sector stakeholders, such as groups like the Electricity Distributors Associations and the Power Workers’ Union. These stakeholders provide feedback on how the APO can be improved for the following year’s iteration, with the IESO responding to the feedback.[77]
While the current direction is positive and worthy of encouragement, there are areas in which the APO and the IESO’s forecasting can improve. There is also a continuation of issues seen in previous provincial outlooks.
First: the continued over-estimation of future demand, even in the short run. The 2019 APO (released in January 2020) predicted that, despite declining demand for years, “[e]lectricity demand is expected to increase slowly and steadily due primarily to electrification of transportation, a booming agricultural sector, and modest growth in the residential and commercial sectors.”[78] As such, in both its forecasted scenarios,[79] total Ontario demand was expected to grow to 144 TWh in 2020 and to either 170 to 162 TWh in 2040 (depending on the scenario). Observing the actual 2019 energy demand of 135.1 TWh, the IESO was thus forecasting an increase of 6.8 percent. In reality, energy demand in Ontario continued to decline from 2019 to 2020, with actual 2020 electricity consumption only at 132.2 TWh.[80] This is a further decline of -2.2 percent. This discrepancy between the actual and forecasted is observed in figure 1.
Figure 1: Real and forecasted energy demand growth (TWh; 1997-2040)[81]
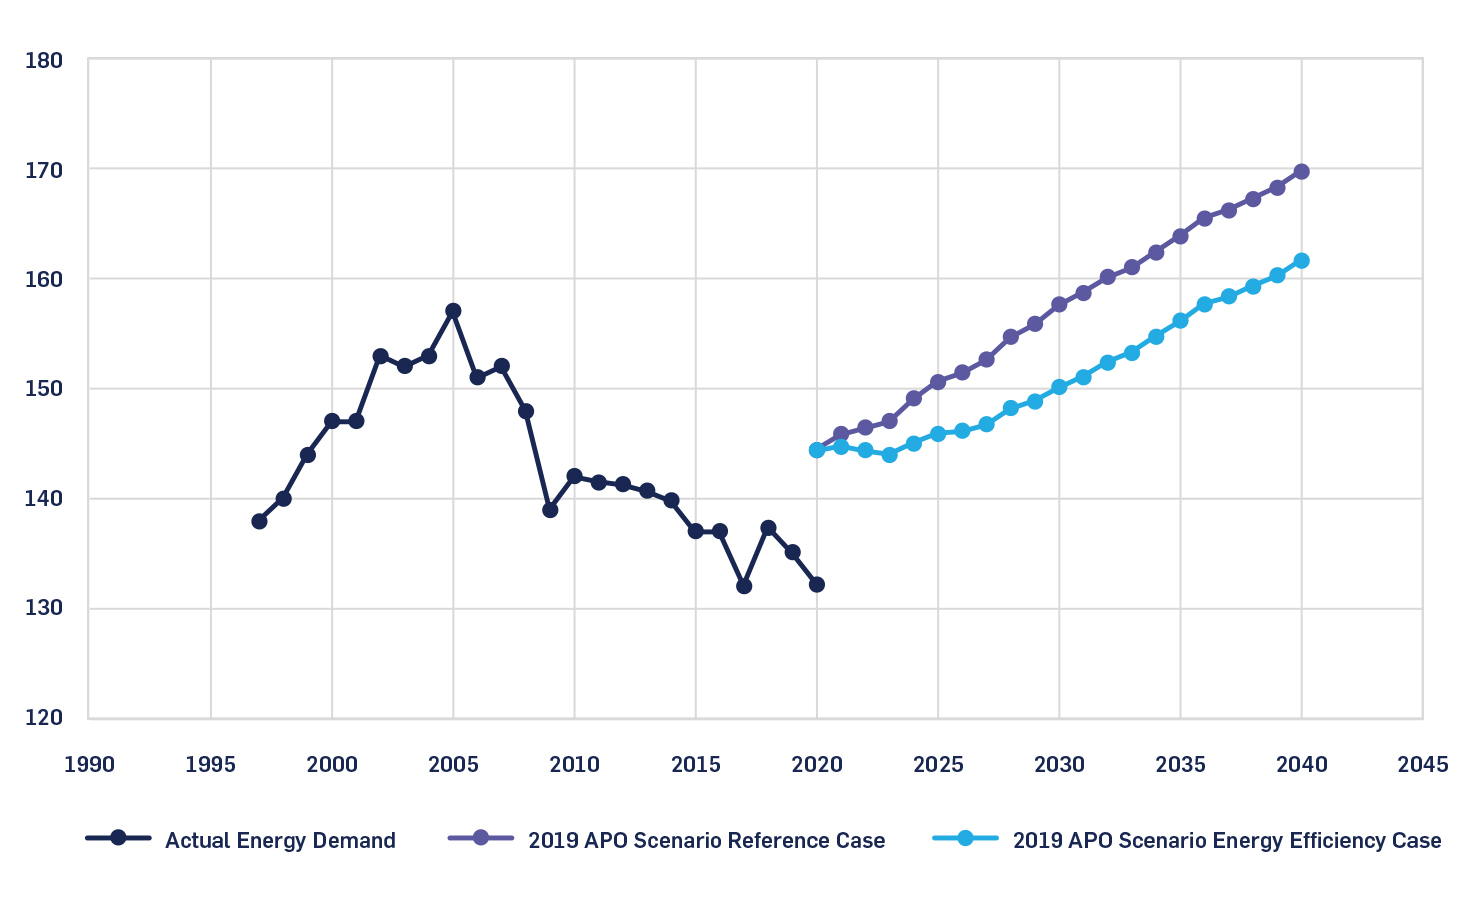
The IESO then continues a pattern of over-estimating demand and forecasting down in future reports seen from the IPSP to the 2013 LTEP.[82] This is not to criticize the IESO for failing to predict the extent of COVID-19 pandemic; frankly, few predicted the magnitude of the pandemic or how it would affect energy consumption early on. However, it is instead to illustrate that despite the new packaging, some of forecasting biases seen in the last two decades, such as over-estimating provincial demand, still remain.
Issues of transparency and clarity with the forecasting information and the report’s assumptions also remain. IESO provides a good deal of information with regards to assumptions and methodologies, but some components of the forecast have been characterized as confusing regarding what assumptions the IESO is making when coming to its predictions. Some stakeholders, in providing feedback with the last APO, expressed confusion and the need for greater clarity on a few fronts. These included confusion over the expiring supply contracts and how they were incorporated into the IESO’s supply forecast and detail over assumptions pertaining to forecasted gas supply.[83] Some were quite critical on the level of detail the APO provided in terms of its assumptions, inputs and methodology.[84]
The need for greater clarity and transparency was articulated by the Ontario Energy Association in the IESO outlook engagement for the 2020 APO:
“The OEA acknowledges the efforts of the IESO in the evolution of the planning process to provide more data and increase participant’s understanding of the evaluation criteria. While there has been progress on this issue there remains substantial work to increase transparency and clarity of the IESO planning process especially as the province enters a period of tight capacity supply and the potential need for new resources.”[85]
Understanding that stakeholders themselves hold biases, there remains concern over the forecast’s transparency and clarity, especially given that these critiques come from sectoral stakeholders who possess expert capacity in their own right. Put bluntly, if the documentation and its organization is confusing for some of the sectoral stakeholders, there is a greater chance it is confusing for laypeople interested in the forecasts or for policy decision-makers with a less technical understanding of the energy sector.
While the IESO provides details of what inputs have gone into the forecast, it does appear to stop short of providing the explicit details that may be required to stress-test such assumptions. For instance, in observing the demand forecast methodology, IESO provides a laundry list of agencies to which the agency compared its demand forecast results and end-use consumption trends,[86] and occasionally the reports used which provided the data for its calculations.[87] Yet in other instances, the agency does not readily provide the names of third-party consultants it engages for key drivers of the forecast, nor the research documents; in the latter case, the IESO’s electric vehicle charging projection information lacks specificity in terms of research and reports that guided its assumptions regarding growth.[88] This argument also extends to the IESO’s relationship with government. Simply put, the public is not privy to all the information and direction provided by the Minister that may be guiding the agency’s assumptions. Sufficient transparency, as well as proper sourcing and citing, is critical to ensure that the results expressed are reasonable upon scrutiny. Thus, it is reasonable to wonder about the judgements that drove these projections and whether they were the correct judgments to make in the first place.
The IESO is open to improving its transparency and providing further information about its assumptions, analysis, data and methodologies in future APOs, as well as to consider new ways to provide other data and information publicly.[89] The agency has a “just ask” policy in terms of being open to information.
Yet being transparent requires more than just providing the information; it means providing it in a clear, accessible and straightforward format. Bistline et al. (2021) characterizes this as the difference between transparency and “deep transparency,” particularly in an age of growing calls to address climate change.[90] They argue that more forecasters are making their data and equations public in the context of difficult policy decisions surrounding climate change, but that the need for transparency extends beyond that; deep transparency “requires making structural assumptions explicit, creating opportunities for interdisciplinary engagement, and explicitly communicating value-laden assumptions to stakeholders.”[91]
Under these three factors, Ontario’s forecasting can certainly improve.
Another area where IESO’s forecasting can improve is with regard to greater incorporation of climate change and public policy impacts. Indeed, stakeholders have highlighted a desire for more forecasting related to impacts of climate change on electricity demand and supply given different climate policy scenarios for future APOs.[92] Such scenario building to address the climate change impacts on the grid and where/when peak demand occurs will change our understanding of the capacity we need; research has observed that climate change impacts will result in significant increases in both frequency and intensity of peak loads and thus have effects on investment needs to address peak generation capacity, transmissions and storage.[93] While the IESO incorporated a forecast of electricity sector greenhouse gas emissions into the 2020 APO, it has acknowledged that this could be an area of improvement. Indeed, research has discussed if such incorporation may require a more radical transformation, and whether current energy modeling can provide “sufficient relevant insights on system feasibility, actor behaviour, and policy effectiveness.”[94]
The IESO is aware that there is a need to integrate climate change policy into its thinking. As noted in response to the stakeholder feedback, the agency stated that, “[i]t is expected the 2021 APO and future APOs will also consider the potential impacts of climate change on its demand forecast and supply assessments.”[95] Questions then arise over the mandate of the IESO as an independent government agency, the purpose of the APO in relation to such scenario building, and incorporation of public policy into forecasting more generally.
As a government agency, the IESO is ultimately accountable to the government of the day. Recent trends in Ontario have moved the needle towards such independent agencies acting more as instruments of government policy.[96] Thus, such agencies arguably become more susceptible to short-term political pressures, rather than long-term analysis that may be required when forecasting out 20 years or more. Such evidence is observed through the government’s use of directives to these agencies, and with the previous outcome-based scenario building related to the government’s carbon initiatives. Such scenarios were used seemingly as more of a lobbying document, to justify the direction of the government. A less independent government agency may have difficulty putting out a forecast that is different from the will (or even the perceived will) of the government it serves.
In terms of climate change initiatives, the IESO does not have an emissions mandate from government, unlike other agencies like the modernized Canada Energy Regulator. Further, the provincial government has either been opposed to such initiatives (as observed by taking the so-called carbon tax to court) or has been apathetic or indifferent to decisions it has to make. Such policy indecision at the provincial level makes it difficult for a government agency to forecast accurately without making judgements of what the government may do.
Additionally, the IESO strictly limits itself to policies that are clearly identified and does not speculate on what policies may be in the future. This position, where only present day policy is expressed in the model, is observed by how the IESO addressed new interest in electric vehicle uptake and electrification by the federal government, following the release of its December 2020 APO.[97] However, an observer of federal policy would have seen enthusiasm well before this forecast, as evidenced by programs included in the 2019 federal budget.[98] They might reasonably have come to the conclusion that federal government policy on this matter was likely not to remain at a growth rate of 0, so to speak. The IESO, using the analogy of hockey as noted previously, has decided to watch the puck in diu terminus, rather than where policy is going.
There is still great value in scenario- building for decision-makers in trying to comprehend the future but it should be done without blinders. Unfortunately, it is clear that there is both hesitancy on the part of the provincial government to articulate positions that would greatly assist the development of the IESO’s forecasts, and hesitancy on the part of the IESO to even attempt to predict where public policy is heading. In both cases, the value of an energy forecast diminishes. As outlined previously, it is questionable whether a government agency can truly pursue its forecasting mandate without at least some hypothesizing of future policy.
Finally, the forecast, its methods and assumptions remain outside of the purview of adjudicative stress-testing. Despite the stakeholder engagement conducted by the IESO after the report’s release, the level of inspection provided by stakeholders submitting a feedback form pales in comparison to a hearing process by an adjudicative tribunal such as the OEB. The APO is published by the IESO at any point of its choosing with no significant testing of the assumptions, methodology and forecasts. The lack of “deep transparency” further compounds this matter. An OEB review of the province’s planning documents, similar to that under the IPSP, has been recommended consistently by various stakeholders in the sector, most recently at the Ontario 360 roundtable.[99] Furthermore, as outlined in section one, the OEB’s stress-testing for forecasts produced by utilities has been shown to adjust for bias and allows for greater transparency and trust in terms of modelling. While it is questionable whether such a requirement would be adhered to given recent history and the relationship between the IESO and the OEB,[100] such an adjudicative model is consistent with the regulatory system in other North American jurisdictions.
In July 2021, the IESO released its first Annual Acquisition Report (AAR). The purpose of the AAR is to build upon the APO’s forecasts and provide greater details on how the IESO will procure supply needs identified in the forecast, in the short-, medium- and long-term. The report is interesting for a few reasons. First, in building upon the APO, the IESO refines some of its forecasts. This includes incorporating a “non-firm import assumption,” thereby reducing the year- round forecasted capacity needs by 250 MW.[101] The IESO also further states how future APOs may be improved upon and address transportation electrification and future carbon policies.[102] Second, the report does provide some clarity over the government’s and IESO’s position regarding new and expiring contracts and actions taken by the IESO.[103] Thus, the report attempts to address stakeholder concern over uncertainty of the supply contracts as stated in the 2020 APO. Last, the report seems to incorporate an “allowance” for potential government policy into its future planned actions and respective figures.[104] These values are marginal and unclear; the IESO offers no real explanation in the tables over how these specific projections have been determined.[105] However, the values do indicate that the IESO may be more open to anticipating potential government policy decisions.
However, notwithstanding positive signs with the AAR, improvements still need to be made to the current long-term forecasting. Moving forward, decision- makers at the IESO and the Ministry of Energy need to address the following in regard to the province’s forecasting procedures:
- The continued tendency to over- estimate electricity demand and any inherent biases that may skew how the forecast is produced.
- Confusion and lack of “deep transparency” in relation to the inputs and assumptions of the forecast.
- How climate change scenarios and incorporation of public policy are addressed with provincial forecasting. This includes discussions over policy clarity and anticipating public policy.
- The regulatory framework and any other ways to stress-test the forecasting models, including solutions in relation to (2).
Ontarians look to the IESO as the experts and to their forecasts in making critical energy decisions. Local and regional planning is made with their analysis in mind. All forecasts are wrong; that is, they will not predict with absolute certainty what the future will be. However, that is not to say that there are not ways to improve forecasting, its processes and the information that it provides to Ontarians. Further, as Hong et al. (2015) observes, “a model that forecasts well in one year may not generate a good forecast for another year.”[106] While there are promising signs and intentions with the APO, the above four points should be addressed by decision-makers.
Section 3: Insights from Elsewhere
As observed with the IESO’s APO, there are areas to emphasize – such as transparency, stress-testing and removal of bias – to do forecasting well. The four points outlined at the end of section two are key. Here are examples from other jurisdictions that underline what to emphasize, and perhaps what not to.
3.1 Optimistic Forecasts and BC Hydro’s Site C Hydro Project
As outlined in section one, forecasts are affected by the implicit bias held by those who are conducting the projections. This includes the purpose of the outlook and whether there is some kind of encouragement for the forecaster to over or under-estimate.
With this in mind, it is worth observing the analysis conducted by Hendriks et al. (2017) on B.C. Hydro’s forecasts, leading to the approval of the Site C Hydro Project.[107] The report analyzed B.C. Hydro’s forecasting methods and accuracy and how an inaccurate over-estimation of demand led to approval of the project despite the fact that such supply has proven to not be needed.
The Site C Project is a multi-billion-dollar hydro dam on the province’s Peace River that is currently under construction. The project, first proposed in the 1980s, was foreseen to meet B.C.’s future electricity needs.[108] However, such future needs were never to be realized and the project would instead contribute to an electricity surplus sold at a loss.[109]
Researchers analyzed BC Hydro’s load forecasting history and found that the organization over-estimated 85 percent of its forecasting data points since the 1980s.[110] Since the 1990s, mid-load projections were overestimated 90 percent of the time, meaning that, as a forecast, they were “expected to exceed actual future requirements 90% of the time.”[111] Some of these overestimations were quite large: from 1996 to 1999, the utility overestimated requirements by 14,000 to 18,000 GWh/year, or “about three times the average annual generation of the Site C Project.”[112] Furthermore, the monopoly’s 20-year forecasts were overestimated by an average of more than 25 percent (or 14,445 GWh/year).[113]
Critically, researchers found that the decision to build the project was based on a high load forecast produced by the utility in 2013. This forecast was noticeably higher than estimates made before or since. The forecast leading to the decision on Site C, “raises questions about whether BC Hydro’s load forecasting was strategically optimistic in order to support a favourable decision by government to develop the Site C Project.”[114] Of interest is that, following the 2013 forecast and approval of the project in 2014, the utility presented the project as surplus energy on the grid, with its electricity to be sold at a loss when it comes online. This was despite the key rationale for the project having been to address the province’s growing electricity needs.
Understandably, there is risk asymmetry in terms of running an electricity surplus versus running a deficit in the context of the public interest. However, by running an extensive electricity surplus, issues of affordability become more salient as surplus energy is exported at prices below the cost of production, as was analyzed by the researchers.[115] This is even excluding environmental costs associated with greenhouse gas emissions. Further, problems have continued with the large-scale project, including delays, cost-overruns and geotechnical issues; the B.C. Utilities Commission has also described the BC Hydro’s mid-load forecast as “excessively optimistic.”[116]
While there are differences in terms of the energy landscape between B.C. and Ontario, it is apparent that Ontario is not unique in having demand forecasts historically over-estimated.[117] In scrutinizing Ontario’s forecasting, it should be seen through a lens that “all forecasts are wrong” and that forecasting long-term is next to impossible to get accurate.
Further, it appears that, based on Hendriks et al.’s analysis, Ontario is not the only province to have an energy monopoly over-estimate demand to justify desired energy outcomes. Forecasts, despite their inherent uncertainty, can be used as critical evidence to justify large-scale outcomes. This raises questions around the extent to which large-scale project decisions should depend on a forecast that may contain inherent biases, as well as the place of “outcome-based forecasting.”
3.2 The Canada Energy Regulator and “Deep Transparency”
As outlined in section two, there is a desire for Ontario’s forecasting to be clearer and more transparent and to address climate change policy scenarios. In enhancing forecasting on these fronts, it is worth examining the recent practices undertaken by the CER’s Canada Energy Futures outlook.
The CER (formerly the National Energy Board) is the federal energy regulator. In addition to regulating and licensing inter-provincial and international energy projects, the regulator has published energy demand and supply outlooks since the 1960s.[118] In recent years the regulator has explored policy projections over time; for instance, exploring what would happen if the carbon price increased over time in tandem with the adoption of new technologies.
The agency’s 2020 energy outlook continues this evolution, not just showing projections based on the policy of the day, but scenarios based on hypothetical futures for public policy. The 2020 Canada’s Energy Futures Report explores “how possible energy futures might unfold for Canadians in the long-term,” providing projections to 2050.[119]
The report highlights two cases: a Reference Energy System Scenario (Reference Scenario), and an Evolving Energy System Scenario (Evolving Scenario). The Reference Scenario is the baseline projection, and is based on the assumption that actions to address climate change are more static and limited to measures currently in place with modest technological developments over time (“only policies in place at the time of analysis are included.”)[120] The Evolving Scenario, as its name implies, “considers the impact of continuing the historical trend of increasing global action of climate change throughout the historical period.”[121] For this scenario, the forecasters, in developing the projection, assumed “a hypothetical suit of future domestic policy developments that build upon current climate and energy policies.”[122] The two scenarios related to total energy demand in Canada are observed in figure 2.
Figure 2: Total end-use demand (in petajoules), CER 2020 Evolving and Reference Scenarios (2005-2050)[123]
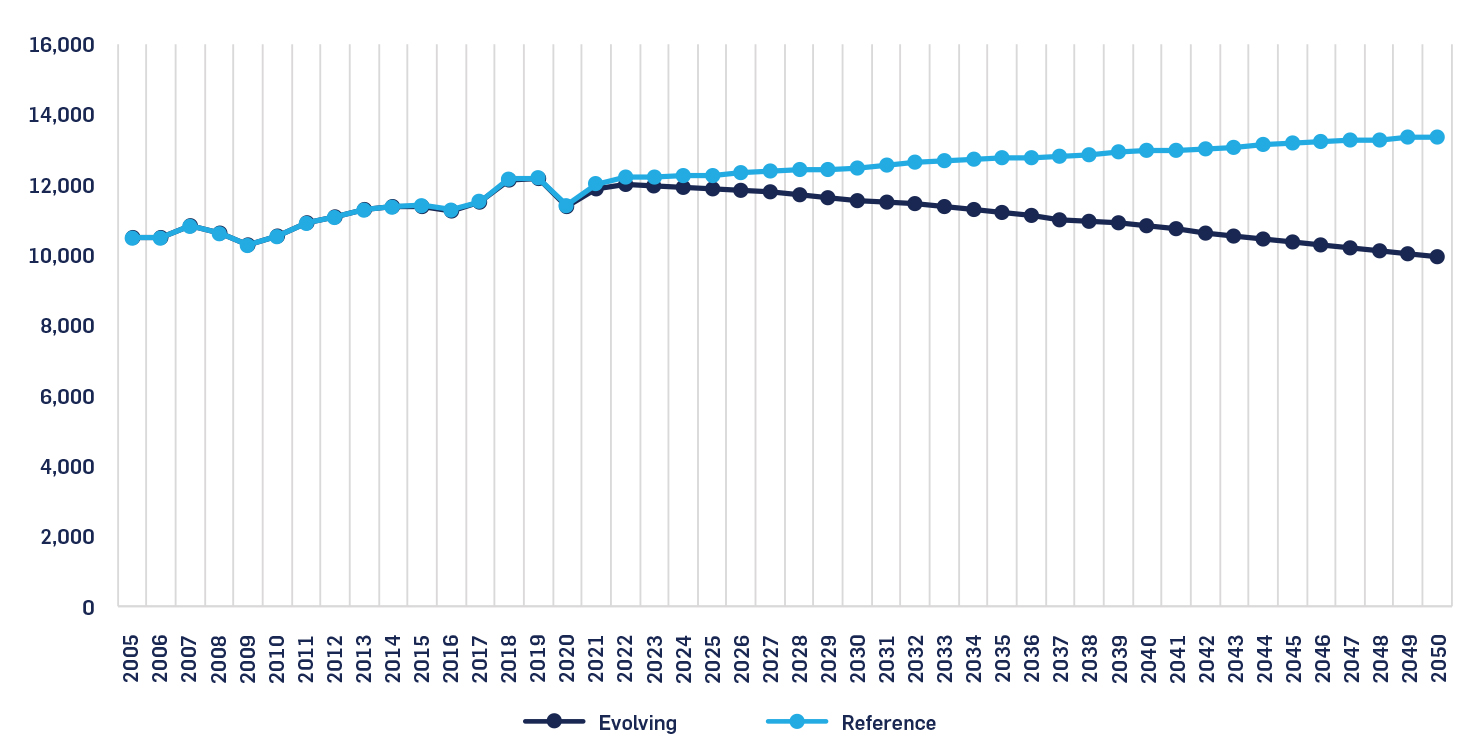
The report focuses primarily on the Evolving Scenario and the key feature of “continued change.”[124] This focus on the Evolving Scenario compared to the Reference Scenario seems to stem from the rapid change that has been occurring regarding climate policy and energy efficiency policy since the mid-2010s, such as the development of the pan-Canadian framework in 2016. Such rapid policy change meant that projecting out 30 years based on only the policy of the day, as was the case with the Reference Scenario, was not sufficient. Thus, the Evolving Scenario has been the centre of the outlook’s analysis.
The 2020 outlook is clear and explicit about assumptions made, leaving no ambiguities regarding judgements and assumptions made to forecast the scenarios. The report also provides extensive sourcing, hyperlinks and footnotes throughout to provide rationale for the assumptions. Further, a detailed appendix of both the current and assumed future domestic policy initiatives is provided.[125] This is all in addition to resources provided to laypeople, students and teachers, including a comparison of the 2020 outlook with previous reports.[126] Such clarity of analysis allows for greater interdisciplinary engagement consistent with “deep transparency.”[127]
This is not to say that the CER is free of its own biases in generating predictions. Concern has been expressed over independence with the change in governance structure from the former NEB.[128] Nor does the explicit outlining of policy assumptions necessarily mean that they are the correct assumptions. For instance, the outlook, which was published in November 2020, assumed that, in terms of Canada’s pipeline capacity and exports, Keystone XL would be fully completed and operational in future.[129] However in June of this year, the contentious pipeline project was cancelled.[130]
Still, by providing deep transparency, policy decision-makers and stakeholders have a better understanding of the details that have guided the projections and thus where the CER may hold internal biases. Such actors may disagree over future policy initiatives included in the Evolving Scenario, such as the increase in the carbon price to $125 by 2050.[131] But at least the actors can clearly observe the judgements taken by the CER and determine where they may agree or disagree.
The notion here is choice: stakeholders are not beholden to the viewpoint of just the CER, but are capable of critically analyzing the agency’s assumptions and come to their own projections and thus their own decision-making. This arguably allows for greater innovation and inter- disciplinary debate over where Canada may be heading with its energy future.
There is of course a balance that the CER has to strike with this exercise as an independent government agency; this includes providing these predictions based on policies not yet announced, and not being too prescriptive with its policy package in terms of reaching net-zero. This caution is exemplified in a few notices in the outlook on its use and interpretation:
- “It is important to note that the projections presented in EF2020 are a baseline for discussing Canada’s energy future today and do not represent the CER’s predictions of what will take place in the future.”[132]
- “Any assumptions made about current or future energy infrastructure, market developments, or climate policies, are hypothetical and have no bearing on any regulatory proceeding that is, or will be, before the CER.”[133]
- “This report is not an official, or definitive, impact analysis of any specific policy initiative, nor does it aim to show how specific goals such as Canada’s climate targets, will be achieved.”[134]
- “The future domestic policies included in the Evolving Scenario are entirely hypothetical and are not a recommendation, prediction, or evaluation of future policies that governments may choose to enact.”[135]
Further, the agency in the outlook does not explicitly model climate goals and government targets in the scenarios. This can be seen as attempting not to merely provide “policy-based evidence” for governments through its scenarios. Striking the right balance and engaging in the prediction of future policy as an independent agency may be of concern for agencies like the IESO in attempting to develop an “Evolving Scenario.” Some agencies may not attempt to generate such projections if they feel it extends beyond their legislative mandate. However, the CER is certainly not shying away from making value-laden assumptions over the future direction of energy policy in Canada. It is arguably difficult for technical experts to embrace being explicit and transparent without being prescriptive in their assumptions, at least to some extent.
The practices undertaken by the CER outline its value-laden and structural assumptions, sources and rationale for the scenarios, allowing for greater inter-disciplinary engagement. Such characteristics are consistent with the idea of “deep transparency,” which can facilitate greater public confidence and improve the discourse around decision- making in the context of rapid policy shifts. Further, by creating an Evolving Scenario, the CER makes one key correct assumption: that the policy landscape around energy and the environment is changing rapidly and will not be static for 30 years. Such forays into scenario reconnaissance are valuable, even if they are uncomfortable for the non-elected experts involved in the exercise.
As this is the CER’s first net-zero outlook to 2050 as well as the first outlook where the Evolving Scenario is central to the analysis, the agency is still working to improve the modelling that went into the report. Still, Ontarian decision-makers might consider exploring the outlook and how it projects scenarios, incorporates and rationalizes future policy packages, organizes and communicates key uncertainties, and engages in practices of “deep transparency.”[136]
3.3 Federal Fiscal Forecasting
There are many differences between fiscal and energy forecasting, but the governance involved and the principles desired, such as deeper transparency and stress-testing, remains the same. And much like energy forecasting, marginal adjustments in the inputs that impact Canada’s revenues and expenditures can lead to drastically different outlooks.[137] This means that, like energy forecasting, there is an “unavoidable level of uncertainty” with fiscal forecasting.[138] Given this, the federal fiscal forecasting process is a useful point of comparison.
In the mid-1990s, concern arose over the credibility of the federal fiscal forecasting process and the ability of the Department of Finance to provide an accurate estimate of the budget deficit. In previous years, the government had consistently underestimated the size of the deficit. In response to these concerns, Ernst & Young (EY) in 1994 released a report containing recommendations to enhance federal fiscal forecasting, including forecasting methodologies, data inputs and tracking against the forecasts.[139]
The government accepted many of the report’s recommendations and made substantial changes along those lines to the 1995 Budget.[140] These included greater utilization of private economic forecasts in preparing key variables for the government’s outlook.
With this model, the Department of Finance invites roughly 15 private forecasters to contribute and calculate key variables, such as real GDP growth, the unemployment rate and interest rates.[141] They come from various institutions, including from BMO Capital Markets, the Conference Board of Canada, Scotiabank and the University of Toronto.[142] Core economic forecasts are requested, and the Department of Finance takes the data and calculates averages.[143]
There are costs and benefits to such utilization of outsiders, including from the private sector. In terms of the benefits, research has shown that the use of average economic forecasts “both in Canada and elsewhere, have a better track record than any individual forecaster.”[144] The government has supported this approach, noting that the practice “introduces an element of independence into the fiscal forecast.”[145] Research conducted for the International Monetary Fund has also supported this model.[146]
In 2005, Tim O’Neill[147] provided a 10- year follow up review of federal fiscal forecasting. The issue of forecasting credibility was flipped; whereas the department had previously underestimated the deficits, it was then underestimating the extent of the budget surplus, with the government achieving surpluses larger than projected.[148] In examining the track record of the private forecasters, O’Neill observed several takeaways. First, private forecast variables did contribute in some cases to budget projection differences, however much of the problem over the persistent under-forecasting of budget surpluses related to other issues, including the government’s “no-deficit rule.”[149] Second, while some forecasted metrics (such as the unemployment rate) were accurate and easy to do,[150] others were much harder to do with any confidence. Third, there appeared to be no specific bias in over-estimating or under- estimating. For example, O’Neill observed the following in relation to real GDP growth:
“Although for some of the series the forecast misses have been rather large, there is no indication that the private sector forecasts are consistently off in one direction or another. For example, for real GDP, the average of private sector forecasts was below the actual on five occasions and above in the other five. In the last five years of the period examined, they have been under three times and over twice.”[151]
The private sector “average” approach for key forecast variables is by no means the perfect solution to address inaccuracies. As O’Neill observed in 2005, it did contribute to forecast inaccuracies. More recently, some commentators have been critical of this approach, particularly of the ability of forecasters to predict GDP.[152] Others have called for an end to the practice altogether, noting the fluctuating number of forecasters and the sometimes wide band of predicted variables provided by the economists.[153]
However, there seems to be some value in drawing from a large swath of perspectives in order to eliminate any potential skewed biases. O’Neill in his review concluded that much of the underestimation of the budget’s revenue surplus was guided by the government’s “no deficit” fiscal target, which skewed the department to incorporate abundant prudence into the model.[154] Additionally, the average has by no means been a dogmatic measure: the Department of Finance having previously adjusted averages based on its own analysis.[155]
Returning to energy, energy forecasters like the CER already engage with third-party expert forecasters to examine key variables to guide their assumptions, like oil and gas prices. The IESO also engages with select third-parties too. For instance, the 2020 APO noted how, in 2015, IESO procured the services of a third-party consultant to provide an assessment of electricity savings resulting from energy-efficiency product performance standards.[156] As described in the APO’s methodology, the consultant provided the analysis and values and the IESO addressed why and where its own analysis deviated from the consultant’s values.[157] The IESO has since updated the values to current standards based on the analysis. The question is whether IESO’s level of engagement is sufficient. Further challenges include which organizations might provide input; private industry and environmental advocacy groups might have the capacity but they also come with biases driven by their mandate.
Yet there is clear value in obtaining more perspectives and values over key forecasting metrics in hopes of reaching an “average,” especially regarding contested matters such as the effects of conservation and the uptake of EVs. It is beyond this report to specify the exact key metrics or the governance structure of how IESO would run such a process (i.e., would the average value be used or could the IESO adjust the average based on its own knowledge?). However, exploring the viabilities of such a model and expanding the utilization of outside actors might enhance the transparency, independence and rigour of Ontario forecasting.
Conclusion and Key Takeaways
This report has provided an overview of forecasting, including its importance in the energy sector, and the effects of inputs, biases and the incorporation of public policy; an analysis of forecasting in Ontario from Ontario Hydro to the IESO’s APO; and insights from other jurisdictions. The authors conclude with key takeaways for Ontario decision-makers:
1. Forecasting is a multi-faceted complex process, riddled with biases and expert value- judgments: Predicting the future is hard, whether you’re a tarot card reader or an energy forecaster. When parsing a forecast in the energy sector, decision-makers – whether they be the experts who develop the outlook or government officials or the stakeholders who use the information – should be aware of structural, cultural and psychological biases (like the overconfidence and recency effects), including in terms of determining inputs. Decision-makers should come to a balanced view regarding how they utilize the forecasts. Further, governments can assist by providing greater clarity over measures that will affect the forecast.
2. Ontario’s outlooks have been flawed and should be subject to scrutiny: Ontario has a long history of inaccurate and biased forecasting dating back to Ontario Hydro. Ontario Hydro’s over-optimistic, and nuclear- driven demand forecasts meant that ratepayers were left paying its debt long after its own demise. Forecasting in the 2000s too had flaws in forecasting predictions and methodologies, continuing the trend of over-estimating demand and using forecasts as a means toward a desired policy end. The IESO’s new APO has good intentions in being more open and in providing an outlook for decision-makers as an end in itself. However, there are areas where improvements can be made, as outlined in conclusion four. Overall, there seems to be validity to the contention that Ontario has a structural weakness when it comes to energy forecasting.
3. Ontario is not the only jurisdiction with forecasting woes: While criticism seems warranted, it should also be placed within the larger context of the challenges of forecasting generally, and compared to elsewhere. Ontario is not the only jurisdiction that fell for “nuclear mania” in the 1970s, nor is it the only province where biased, over-optimistic and outcome-based forecasting has occurred and had deeply negative impacts.
4. Opportunities exist to enhance provincial forecasting: The APO has good intentions and is heading in the right direction. All forecasts need to regularly improve upon their methods, data and assumptions and this outlook provides a strong basis in which to enhance provincial forecasting. In particular, this report flags four challenges going forward:
a) a continued tendency to over- estimate electricity demand;
b) confusion and a lack of “deep transparency” in relation to inputs and assumptions;
c) the methods to incorporate climate change scenarios and public policy responses into the forecast (including the anticipation of future policy);
d) and, further ways to stress-test, and gather knowledge and perspectives for the forecasting models.
These four challenges should be pondered by decision-makers.
5. Provincial decision-makers should examine the models used by the CER and the Federal Department of Finance when seeking to enhance forecasting: Ontario decision-makers might consider exploring the CER’s Canada Energy Futures outlook and how it projects scenarios, incorporates and rationalizes future policy packages, organizes and communicates the key uncertainties, and engages in practices of “deep transparency.” Further, while the IESO already engages with third-party consultants, it is worth considering whether more outside expertise could be utilized for key forecasting variables, as the federal Department of Finance did. Decision- makers might review closely these models to see if there are methods and techniques that could enhance Ontario energy forecasting.
George Vegh is an adjunct professor of Regulatory Law at the Munk School of Global Affairs and Public Policy and of Energy Regulation at the University of Toronto Law School. George is also Vice-Chair of the Canada Energy Regulator (CER).
Ian T.D. Thomson is an independent policy & governance consultant. He has engaged in energy policy research and analysis for the University of Ottawa’s Institute for Science, Society and Policy (ISSP), and the Ontario 360 project. He is currently pursuing a Juris Doctor in Law at the University of Toronto.
For more information about Ontario 360 and its objectives contact:
Sean Speer
Project Director
[email protected]
Drew Fagan
Project Director
[email protected]
on360.ca
NOTES
[1] George Vegh is an adjunct professor of Regulatory Law at the Munk School of Global Affairs and Public Policy and of Energy Regulation at the University of Toronto Law School. George is also Vice-Chair of the Canada Energy Regulator (CER); the views expressed in this paper are in his own personal capacity and do not represent the views of the CER.
[2] Thomson, I. T. D., Fagan, D. and Speer, S. (2021). Reforming Provincial Energy Planning: Summary and Analysis from Ontario 360’s Expert Roundtable. University of Toronto Ontario 360. Retrieved from https://on360.ca/policy- papers/reforming-provincial-energy-planning-summary-and-analysis-from-ontario-360s-expert-roundtable/
[3] Environmental Registry of Ontario. (2021). The Ministry of Energy, Northern Development and Mines is reviewing Ontario’s long-term energy planning framework with a view to implementing a new, more transparent, predictable, and reliable planning process. Retrieved from https://ero.ontario.ca/notice/019-3007
[4] Thomson, Fagan and Speer, supra note 2 at 14.
[5] Government of Ontario Office of the Premier. (2021, Jun. 18). Premier Ford Announces Changes to Cabinet [News release]. Retrieved from https://news.ontario.ca/en/release/1000378/premier-ford-announces-changes-to-cabinet
[6] Natural Resources Canada. (2020) Energy and the economy. Retrieved from https://www.nrcan.gc.ca/science-data/dataanalysis/energy-data-analysis/energy-facts/energy-and-economy/20062#L4
[7] Hong, T., and Shahidehpour, M. (2015). Load Forecasting Case Study. National Association of Regulatory Utility Commissioners, at 1-1.
[8] Hong and Shahidehpour, ibid at 2-2 and 2-3.
[9] Hong and Shahidehpour, ibid at 1-1.
[10] For example, see Canada Energy Regulator. (2020). Canada’s Energy Future, at 20. Retrieved from https://www.cer-rec.gc.ca/en/data-analysis/canada-energy-future/2020/index.html
[11] Hong and Shahidehpour, supra note 7 at 2-1.
[12] Hong and Shahidehpour, ibid at 2-1.
[13] Hong and Shahidehpour, ibid at 1-2.
[14] While there are unique issues related to short-term forecasting, we have chosen to focus on long-term electricity forecasting and planning for this report.
[15] Given all these problems, some experts have argued that forecasting should be dismissed and replaced with some sort of alternative. For instance, Smil in his 2005 book, ar gues against forecasting, highlighting repeated energy forecasting failures over more than 100 years. Smil states that the practice is both counterproductive and engenders “false feelings of insight.” The author calls for a radical departure, suggesting that “no-regret normative scenarios” could be useful. For the purposes of
this report, we have decided stick with forecasting and discuss ways to enhance the practice. However, we have not ruled out the prospect that the practice is a waste of time and that an alternative to forecasting should be seriously considered. Source: Smil, V. (2005). Energy at the Crossroads: Global Perspectives and Uncertainties. The MIT Press, at 121 and 179.
[16] Hong and Shahidehpour, supra note 7 at 1-3.
[17] Hong and Shahidehpour, ibid at 1-3.
[18] Federal Energy Regulatory Commission Office of Enforcement. (2015). Energy Primer: A Handbook of Energy Market Basics, at 43.
[19] Torrie, R., and Morrow, D. (2008). Review of the Ontario Load Forecast in the Integrated Power System Plan (IPSP) [Analysis prepared for the Green Energy Coalition and provided before the Ontario Energy Board]. EB-2007-0707, Exhibit L, Tab 8, Schedule 2 at at 31.
[20] Torrie and Morrow, ibid at 31.
[21] Smil, supra note 15 at 160-161.
[22] Torrie and Morrow, supra note 19 at 14.
[23] For instance, it can be argued that environmental advocacy groups, based on their mandate, may be more inclined to over-estimate conservation programs to address electricity supply deficits if the alternative is developing large-scale and (environmentally unfriendly) generation supply projects.
[24] Hendriks, R., Raphals, P., and Bakker, K. (2017). Reassessing the Need for Site C. University of British Columbia Program on Water Governance, at 26.; Torrie and Morrow, supra note 19 at 25.
[25] Coyle, E. [Capital Power Corporation]. (2021, Feb. 17). Feedback Form: 2020 Annual Planning Outlook Engagement – January 26, 2021. IESO, at 5.
[26] Vegh, G. (2013). Energy Planning: The Case for a Less Prescriptive Approach. McCarthy Tétrault at 11, footnote 34.; Kanheman, D. (2011). Thinking, Fast and Slow. Farrar, Straus and Giroux at 261.
[27] Dobelli, R. (2013, Jun. 11). The Overconfidence Effect [Blog post]. Psychology Today. Retrieved from https://www.psychologytoday.com/ca/blog/the-art-thinking-clearly/201306/the-overconfidence-effect
[28] Dobelli, ibid.
[29] Angner, E. (2006). Economists as Experts: Overconfidence in theory and practice. Journal of Economic Methodology, 13(1), at 23. Retrieved from https://citeseerx.ist.psu.edu/viewdoc/download?doi=10.1.1.118.9725&rep=rep1&type=pdf
[30] SKYbrary. (2016). Recency Bias. Retrieved from https://www.skybrary.aero/index.php/Recency_Bias
[31] Hong and Shahidehpour, supra note 7 at 2-9.
[32] Smil, supra note 15 at 129.
[33] Smil, ibid at 129.
[34] Smil, ibid at 135.
[35] Body of Knowledge on Infrastructure Regulation. (n.d.). Averch-Johnson Effect (AJ Effect). Retrieved from https://regulationbodyofknowledge.org/glossary/a/averch-johnson-effect-aj-effect/
[36] Carvallo, J. P., Larsen, P. H., Sanstad, A. H., and Goldman, C. A. (2018). Long term load forecasting accuracy in electric utility integrated resource planning. Energy Policy, 119, 410-422. Retrieved from https://www.sciencedirect.com/science/article/abs/pii/S0301421518302751
[37] Hendriks et al., supra note 24.
[38] O’Neill, T. (2005). Review of Canadian Fiscal Forecasting: Processes and Systems. Government of Canada, at 55.
[39] O’Neill, ibid at 8.
[40] Yauch, B. (2020). Ontario’s Electricity Market Woes: How Did We Get Here and Where Are We Going. Energy Regulation Quarterly, 8(2), at Part IV. Retrieved from https://energyregulationquarterly.ca/articles/ontarios-electricitymarket-woes-how-did-we-get-here-and-where-are-we-going#sthash.yj6zDfrj.dpbs
[41] Thomson, Fagan and Speer, supra note 2.
[42] Hauser, C., and Sandoval, E. (2012, Jun. 14). Death Toll From Texas Winter Storm Continues to Rise. The New York Times. Retrieved from https://www.nytimes.com/2021/07/14/us/texas-winter-storm-deaths.html . While the reason for the Texas energy grid failure is multi-faceted, at its core, reliable supply was not available to meet the demand in the state, leading to grid challenges and world headlines that no jurisdiction would like to deal with.
[43] Ontario Energy Board. (2021, Jun. 18). IESO and OEB join forces to support innovative projects to help meet province’s growing energy needs [News release]. Retrieved from https://www.oeb.ca/newsroom/2021/ieso-and-oeb-join-forces-supportinnovative-projects-help-meet-provinces-growing
[44] Coulbeck, R. [Ontario Energy Association]. (2021, Feb. 17). Feedback Form: 2020 Annual Planning Outlook Engagement – January 26, 2021. IESO, at 2 and 3.
[45] IESO. (2021). Stakeholder Feedback and IESO Response: 2020 Annual Planning Outlook – January 26, 2021 webinar. IESO, at 6.
[46] Government of Ontario Office of the Premier. (2019, Mar. 13). Ontario to Fight Carbon Tax with Every Tool at its Disposal [News release]. Retrieved from https://news.ontario.ca/en/release/51496/ontario-to-fight-carbon-tax-with-every-toolat-its-disposal
[47] Kellow, A. (1995). Ontario: The decline and fall of the electric empire. In Transforming power: the politics of electricity planning. Cambridge University Press at 113-114.; Swift, J., and Stewart, K. (2004). Hydro: The decline and fall of Ontario’s electric empire. Between the Lines, at 14, 19-20.
[48] Torrie and Morrow, supra note 19 at 2.
[49] Kellow, supra note 47 at 108-110.
[50] Swift and Stewart, supra note 47 at 13, 16 and 19.
[51] Smil, supra note 15 at 129.
[52] Swift and Stewart, supra note 47 at 16.
[53] Torrie and Morrow, supra note 19 at 2.
[54] Torrie and Morrow, ibid at 2.
[55] Kellow, supra note 47 at 112.
[56] Torrie and Morrow, supra note 19 at 3.
[57] Torrie and Morrow, ibid at 3.
[58] Yauch, supra note 40.
[59] Ministry of Energy, Science and Technology. (1997). Direction for Change: Charting a Course for Competitive Electricity and Jobs in Ontario. Ministry of Energy, Science and Technology, at 1. Retrieved from https://collections.ola.org/mon/2000/10270087.pdf
[60] Ontario Ministry of Finance. (2019). Debt Retirement Charge. Retrieved from https://www.fin.gov.on.ca/en/tax/drc/
[61] Yauch, supra note 40.; Torrie and Morrow, supra note 19 at 4.
[62] OEB. (2006). Report of the Board on the Review of, and Filing Guidelines Applicable to, the Ontario Power Authority’s Integrated Power System Plan and Procurement Processes [EB-2006-0207] at 4. Retrieved from https://www.oeb.ca/documents/cases/EB-2006-0207/IPSP_report_final_20061227.pdf at 4
[63] OEB. (2008). EB-2007-0707: In the Matter of an Application by the Ontario Power Authority: Integrated Power System Plan Issues, at 10-11. Retrieved from https://www.oeb.ca/documents/cases/EB-2007-0707/dec_reasons_OPA_20080326.pdf
[64] Vegh, supra note 26 at 4.
[65] Vegh, ibid at 4.
[66] Vegh, ibid at 4.
[67] Torrie and Morrow, supra note 19 at 7, 21, 23 and 25.
[68] Torrie and Morrow, ibid at 7.
[69] OEB, supra note 63 at 2-3 and 10-11.
[70] Vegh, supra note 26 at 5-6.
[71] Vegh, ibid at 5-6.
[72] IESO. (2016). Ontario Planning Outlook Technical Report, at 5-8. Retrieved from https://rise.esmap.org/data/files/library/canada/RE%20Q8.1,2,4/Ontario-Planning-Outlook-September2016.pdf
[73] Vegh, G. (2020). Electricity Procurements in Ontario: Time for a New Approach. University of Toronto Ontario 360, at 9. Retrieved from https://on360.ca/wp-content/uploads/2020/02/Electricity-Procurements-in-Ontario-Time-for-a-New-ApproachFINAL-1.pdf
[74] Vegh, ibid at 9.
[75] IESO. (2020). Annual Planning Outlook: Ontario’s electricity system needs: 2022-2040, at 1.
[76] IESO, ibid at 4.
[77] IESO, supra note 45.
[78] IESO. (2020, Jan. 22). The IESO’s Annual Planning Outlook in Six Graphs [Blog post]. Retrieved from https://www.ieso.ca/en/Powering-Tomorrow/2020/The-IESOs-Annual-Planning-Outlook-in-Six-Graphs
[79] The 2019 APO outlined two scenarios based on whether the IESO’s delivered energy-efficiency programs would end at the end of 2020. The Reference Case outlined the forecast if the programs ended, while the Energy Efficiency Case forecasted demand if the IESO’s programs continued beyond 2020 for the forecasting period. Source: IESO. (2020). Annual Planning Outlook: A view of Ontario’s electricity system needs: January 2020, at II.
[80] IESO. (2021). Historical Demand. Retrieved from https://www.ieso.ca/en/Power-Data/Demand-Overview/Historical-Demand
[81] IESO, ibid.; IESO. (2020). 2019 Annual Planning Outlook Data Table [Data set].
[82] For instance, in the January 2020 APO, 2023 energy demand was estimated to be 144-147 TW; Only a 11 months later with in the December 2020 APO, 2023 energy demand estimates were lowered to 140-144.6 TWh; In the U.S., this pattern of persistent downward revisions of projections is known as the “NERC fan.” Sources: IESO, ibid.; IESO. (2020). 2020 Annual Planning Outlook: Demand Forecast Module Data [Data set].; Hong and Shahidehpour, supra note 7 at 1-4.
[83] Coyle, supra note 25 at 4.; Coulbeck, supra note 44 at 2-3.
[84] Capital Power, in providing feedback to the IESO to the question, “[a]re the assumptions, inputs, and methodology reasonable?” answered the following: “Based on the detail provided, Capital Power is unable to confidently determine whether the assumptions, inputs and methodologies are reasonable. Additional information and detail… would assist Capital Power in answering this question.” Source: Coyle, ibid at 5.
[85] Coulbeck, supra note 44 at 3.
[86] IESO. (2020). Annual Planning Outlook: Demand Forecast Methodology: December 2020, at 10.
[87] IESO. (2020). Annual Planning Outlook: Demand Forecast Module: December 2020, at 13.
[88] “EV charging demand is influenced by many factors, including adoption rates, utilization rates, policy, technology and consumer behaviour. The IESO’s EV charging projections are informed by a wide range of projections from various organizations, including consulting firms, academia and government and government agencies, and have a higher uncertainty than other sectors. The EV forecast is based on historical trends and available information, such as EV sales, vehicle registration data, and forecast from other reputable organizations.” Source: IESO, supra note 86 at 21.
[89] IESO, supra note 45 at 5.
[90] Bistline, J., Budolfson, M., and Francis, B. (2021). Deepening transparency about value-laden assumptions in energy and environmental modelling: Improving best practices for both modellers and non-modellers. Climate Policy, 21(1), at 1.
[91] Bistline et al., ibid at 2.
[92] IESO, supra note 45 at 5-6.
[93] Auffhammer, M., Baylis, P., and Hausman, C. H. (2017). Clima te change is project to have severe impacts on the frequency and intensity of peak electricity demand across the United States. PNAS 114(8). Retrieved from https://www.pnas.org/content/114/8/1886
[94] Pye et al. (2021). Modelling net-zero emissions energy systems requires a change in approach. Climate Policy, 21(2) at 222.
[95] IESO, supra note 45 at 6.
[96] Warren, R. B. (2015). Governance of Regulatory Agencies: Case Study of the Ontario Energy Board. Council for Clean & Reliable Electricity, at 11. Retrieved from https://www.weirfoulds.com/assets/uploads/15118_CCRE-The-Governance-of-Regulatory-Agencies.pdf
[97] IESO, supra note 45 at 6.
[98] Government of Canada. (2021). Zero Emission Vehicle Infrastructure Program. Retrieved from https://www.nrcan.gc.ca/energy-efficiency/transportation-alternative-fuels/zero-emission-vehicle-infrastructure-program/21876
[99] Thomson, Fagan and Speer, supra note 2 at 13.
[100] Vegh, supra note 73 at 15.
[101] IESO. (2021). Annual Acquisition Report, at 13 and 9.
[102] IESO, ibid at 14 and 37.
[103] IESO, ibid at 14.
[104] IESO, ibid at 35 and 36.
[105] IESO, ibid at 35 and 36.
[106] Hong and Shahidehpour, supra note 7 at v.
[107] Hendricks et al., supra note 24.
[108] British Columbia Utilities Commission. (2017). British Columbia Utilities Commission Inquiry Respecting Site C: Final Report to the Government of British Columbia, at 3. Retrieved from https://www.bcuc.com/Documents/wp-content/11/11-01-2017-BCUC-Site-C-Inquiry-Final-Report.pdf
[109] Hendricks et al., supra note 24 at 2.
[110] Hendricks et al., ibid at 24.
[111] Hendricks et al., ibid at 16.
[112] Hendricks et al., ibid at 17.
[113] Hendricks et al., ibid at 25.
[114] Hendricks et al., ibid at 24.
[115] Hendricks et al., ibid at 4.
[116] The Canadian Press. (2021, Mar. 1). British Columbia’s Site C dam to cost $16 billion, delayed until 2025. JuneWarren-Nickle’s Energy Group. Retrieved from https://www.jwnenergy.com/article/2021/3/1/british-columbias-site-c-dam-to-cost-16-billion-de/ ; Cox, S. (2020, Oct. 21). Top B.C. government officials knew Site C dam was in se rious trouble over a year
ago: FOI docs. The Narwhal. Retrieved from https://thenarwhal.ca/site-c-dam-geotechnical-problems-bc-government-foidocs/ ; British Columbia Utilities Commission. (2017). British Columbia Utilities Commission Inquiry Respecting Site C: Executive Summary of the Final Report to the Government of British Columbia, at 3. Retrieved from https://www.bcuc.com/Documents/wp-content/11/11-01-2017_SiteC-Executive-Summary.pdf
[117] Manitoba Hydro has also been accused of developing over-optimistic export predictions. It should also be noted that, at least Ontario has forecasts to critique. Manitoba Hydro recently stated to the Public Utilities Board (who requested revenue forecasts) that “it did not have a current forecast and did not provide the prospective cost of service study or next year’s forecast of net export revenue and net income for a number of water flow scenarios.” Sources: Sanders, C. (2021, Jun. 29). Hydro boss calls out coalition over complaint. Winnipeg Free Press. Retrieved from https://www.winnipegfreepress.com/local/hydro-boss-calls-out-coalition-over-complaint-574730592.html ; The Canadian Press. (2021, Feb. 26). Report says optimistic forecasts, lack of oversight led to big debt at Manitoba Hydro. CTV News. Retrieved from https://winnipeg.ctvnews.ca/report-says-optimistic-forecasts-lack-of-oversight-led-to-big-debt-at-manitoba-hydro-1.5325476
[118] Canada Energy Regulator. (2017). Market Snapshot: 50 Years of Futures. Retrieved from https://www.cer-rec.gc.ca/en/data-analysis/energy-markets/market-snapshots/2017/market-snapshot-50-years-energy-futures.html
[119] Canada Energy Regulator, supra note 10 at 3.
[120] Canada Energy Regulator, ibid at 22-23.
[121] Canada Energy Regulator, ibid at 4.
[122] Canada Energy Regulator, ibid at 4.
[123] Canada Energy Regulator. (2021). Exploring Canada’s Energy Future [data set]. Retrieved from
[124] Canada Energy Regulator, supra note 10 at 22.
[125] Canada Energy Regulator, ibid at 88.
[126] Canada Energy Regulator. (2021). Exploring Canada’s Energy Future. Retrieved from https://apps2.cer-rec.gc.ca/energy-future/?page=landing&mainSelection=&yearId=§or=&unit=&view=&baseYear=&compareYear=&noCompare=&scenarios=&provinces=&provinceOrder=&sources=&sourceOrder=
[127] Bistline et al., supra note 90 at 2.
[128] Harrison, R. J., McCrank, N., and Wallace, R. (2020). The Structure of the Canadian Energy Regulator: A Questionable New Model for Governance of Energy Regulation Tribunals. Energy Regulation Quarterly, 8(1). Retrieved from https://energyregulationquarterly.ca/articles/the-structure-of-the-canadian-energy-regulator-a-questionable-new-model-forgovernance-of-energy-regulation-tribunals#sthash.hs78CqK5.dpbs
[129] Canada Energy Regulator, supra note 10 at 14.
[130] TC Energy. (2021, Jun. 9). TC Energy confirms termination of Keystone XL Pipeline Project [News release]. Retrieved from https://www.tcenergy.com/announcements/2021-06-09-tc-energy-confirms-termination-of-keystone-xl-pipeline-project/
[131] Canada Energy Regulator, supra note 10 at 92.
[132] Canada Energy Regulator, ibid at 25.
[133] Canada Energy Regulator, ibid at 25.
[134] Canada Energy Regulator, ibid at 25.
[135] Canada Energy Regulator, ibid at 23.
[136] Further examples and best practices that encourage deep transparency can be found at Bistline et al., supra note 90 at 7, table 1.
[137] O’Neill, supra note 38 at 5.
[138] O’Neill, ibid at 5.
[139] Ernst & Young. (1994). Review of the Forecasting Accuracy and Methods of the Department of Finance.; O’Neill, ibid at 36.
[140] O’Neill, ibid at 5.
[141] Government of Canada. (2016). Department of Finance Survey of Private Sector Economic Forecasters. Retrieved from https://www.canada.ca/en/department-finance/services/publications/private-sector-survey.html
[142] Government of Canada. (2019). Annex 1 – Details of Economic and Fiscal Projections. Retrieved from https://www.budget.gc.ca/efu-meb/2019/docs/statement-enonce/anx01-en.html ; Government of Canada. (2021). Annex 1: Details of Economic and Fiscal Projections. Retrieved from https://www.budget.gc.ca/2021/report-rapport/anx1-en.html
[143] O’Neill, supra note 38 at 22.
[144] O’Neill, ibid at 22.
[145] Government of Canada, supra note 141.
[146] Government of Canada, ibid.; Mühleisen, M., Krajnyak, K., Danninger, S., Hauner, D., and Sutton B. W. (2005). How Do Canadian Budget Forecasts Compare with Those of Other Industrial Countries? International Monetary Fund Working Paper.
[147] Tim O’Neill, in addition to conducting this review, was also a Board Director for IESO serving as its Chair from 2015 to 2019.
[148] O’Neill, supra note 38 at 1.
[149] O’Neill, ibid at 55.
[150] It is observed that, for the ten-year period examined, the actual unemployment rate value fell within the range of private sector forecasts ten out of ten years. Source: O’Neill, ibid at 58.
[151] O’Neill, ibid at 58.
[152] McKenna, B. (2019, Mar. 15). How serially bad private-sector economic forecasts could hurt Bill Morneau’s federal budget plans. The Globe and Mail. Retrieved from https://www.theglobeandmail.com/business/commentary/article-how-seriallybad-private-sector-economic-forecasts-could-hurt-bill/
[153] Clark, S., and DeVries, P. (2010, Mar. 11). Time to make the budget planning process more accountable, transparent and prudent [Blog post]. 3D Policy. Retrieved from https://www.3dpolicy.ca/content/time-make-budget-planning-process-moreaccountable-transparent-and-prudent
[154] O’Neill, supra note 38 at 8.
[155] Clark and DeVries, supra note 153.
[156] IESO, supra note 86 at 13.
[157] It should be noted that issues of clarity and transparency also come up with this example, as the IESO does not provide the name of the third-party consultant or its original analysis in the 2020 APO Methodology. Source: IESO, ibid at 13.