Policy Papers
Fiscal Policy
Livio Di Matteo on Restoring Ontario’s Long-term Fiscal Sustainability

Introduction
Ontario recently unveiled its 2018 Budget. The government’s short-term budgetary surplus has been reversed. The province is now back into deficit for the foreseeable future.
Ontario incurred nine consecutive deficits from 2007-08 up to the 2016-17 for an accumulated total of $87.1 billion. As well, there was an increase in the net provincial public debt from $156.6 billion to $301.6 billion. While 2017-18 saw a surplus of $642 million, the 2018 Budget now projects a deficit of $6.7 billion and a net provincial debt of $325 billion with deficits projected to continue for five years afterwards.
Even had the budget been balanced for 2018-19, Ontario would still face issues of fiscal sustainability for various reasons. There are the inevitable spending pressures by assorted lobby groups any government faces should fiscal constraints eventually be loosened. As well, Ontario’s debt is expected to increase not only as a result of program spending increases and operating deficits, but also as new capital infrastructure spending is financed. With the anticipated rise in interest rates and subsequent rising debt service costs, as well as the potential for an economic slowdown in the wake of uncertain NAFTA negotiations, Ontario faces fiscal sustainability issues. But the principal source of Ontario’s long-term fiscal unsustainability is the province’s aging population and the anticipated pressure on the province’s health care and social services system.
The remainder of this report will overview Ontario’s finances from a long-term perspective to provide the context for its fiscal sustainability issues. It will then briefly overview some of the anticipated fiscal challenges facing the province and finally outline some recommendations for provincial budgetary and fiscal policy designed to address these challenges.
The Evolution of Ontario’s Public Finances, 1980-2017
Ontario’s present fiscal challenges have been decades in the making and the result of a chronic long-term disposition towards running large deficits during major economic downturns and smaller deficits during recovery periods. While revenues have been impacted in the short-term by recessions, most notably in the wake of the 2008-09 global financial crisis, it remains that even notwithstanding cyclical fluctuations, Ontario has generally spent in excess of revenues as a matter of habit.
Indeed, Ontario does not have a revenue problem per se given that on average over the period from 1981 to 2018, revenues have actually grown slightly faster than spending. However, cyclical downturns have led to periods where quite large gaps have opened up between revenues and expenditures that have taken time to close. Ultimately, addressing Ontario’s fiscal problems require a consistent and persistent effort to mind the gap.
Figure 1 plots Ontario provincial government operating revenues and expenditures beginning in 1980-81 to the present (including projections from the Ontario 2018 Budget.)[1] From revenues and expenditures of $15.0 and $16.3 billion dollars in 1980-81, both have grown to reach $140.7 and $141.7 billion respectively in 2016-17 and are anticipated to reach $157.6 and $164.2 billion by 2019-20.
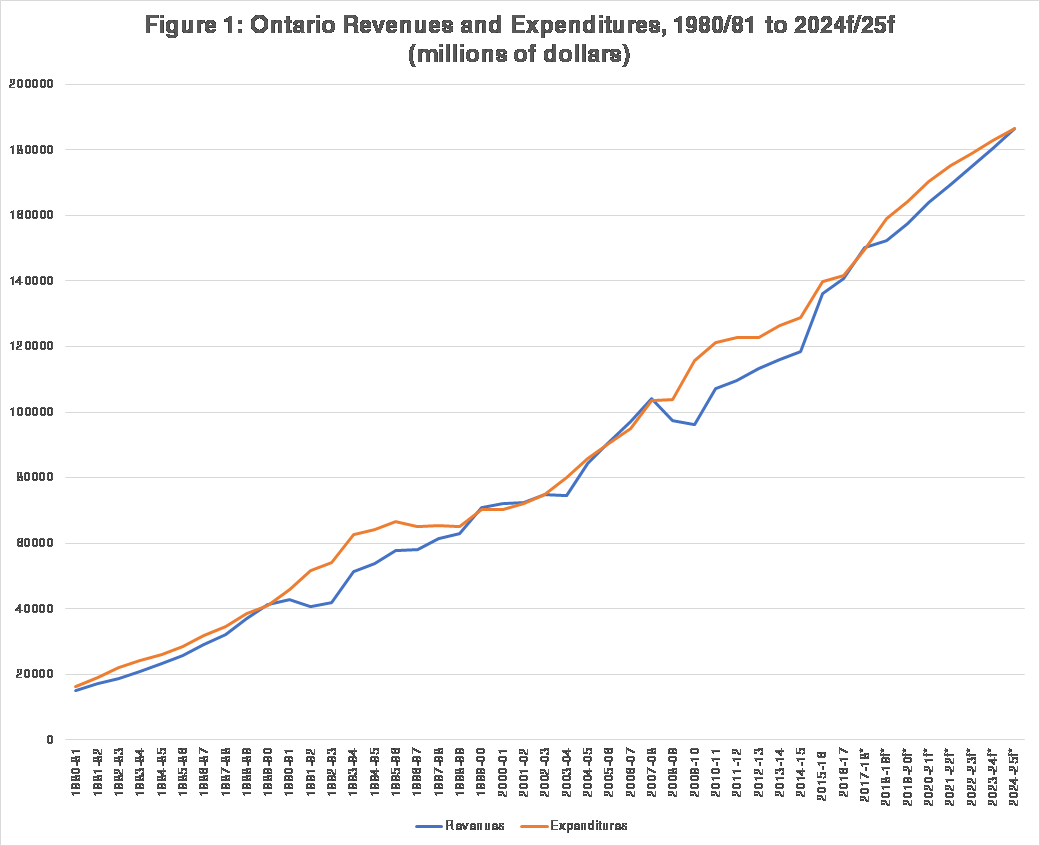
Over the period from 1981 to 2018, revenues grew at an average annual rate of 6.6 percent whereas expenditures have grown at an average annual rate of 6.3 percent. However, during recession and slowdown periods covering the following years – 1981-82; 1991-92; 2003-04; 2008-09 to 2009-10 – revenues grew at an average of 0.4 percent while expenditures grew at 9.6 percent. Moreover, the pace of both revenue and expenditure growth appears to have dropped overall since 2000 with revenue growing slightly slower than expenditures at an average of about 4 percent. This suggests that overall, Ontario’s finances have been hit by revenue and expenditure shocks that generated large deficits that were then allowed to fester over the longer term.
The result has been a tendency towards deficit spending. In fact, over the 37-year period stretching from 1980-81 to 2016-17, Ontario incurred 29 deficits – that is, since 1980 Ontario has run a deficit nearly 80 percent of the time – despite average revenue growth being in excess of expenditure growth over the entire period. Indeed, deficit spending is Ontario’s normal fiscal state of affairs.
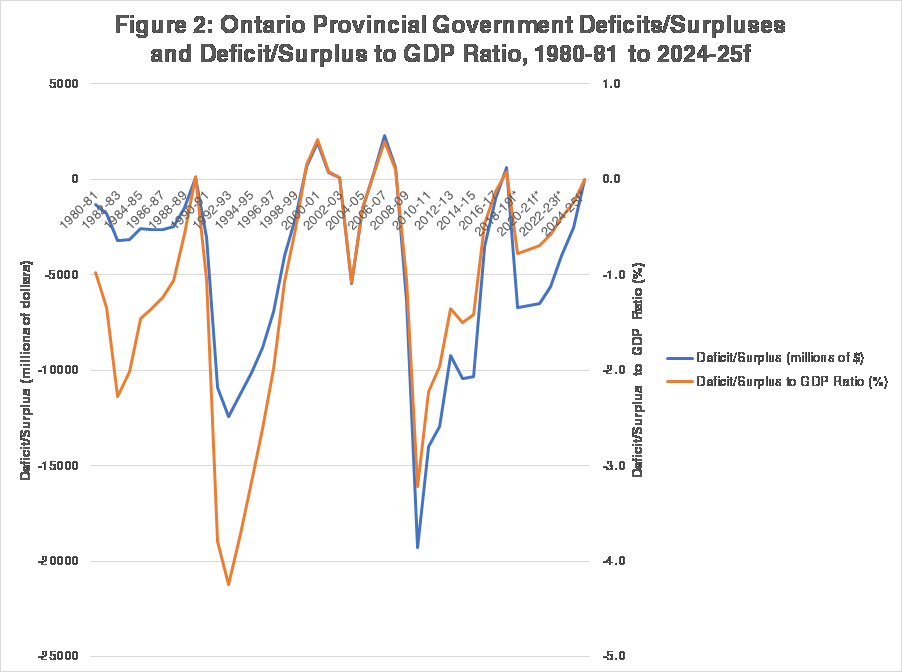
Figure 2 plots Ontario’s deficits both in absolute terms and as a share of provincial GDP. There were nine consecutive deficits from 1980-81 to 1988-89 – a brief fiscal year interlude for 1989-90 that yielded a small surplus – and then nine more annual deficits from 1990-91 to 1998-99. There was then a period of surpluses followed by two deficit years from 2003-04 to 2004-05. There were then surpluses from 2005-06 to 2007-08 followed by nine deficits for the fiscal years 2008-09 to 2016-17.
The 2017-18 fiscal year currently shows an interim surplus of $642 million. Over the entire period from 1980-81 to 2017-18, the largest surplus in absolute terms was $2.3 billion in 2006-07 while the largest deficit was $19.3 billion in 2009-10. Relative to GDP, the largest surplus was in 2000-01 at 0.4 percent while the largest deficit was 1992-93 at -4.2 percent. The accumulated value of deficits since 1980-81 in Ontario has been $177.8 billion. The most recent string of deficits from 2008-09 to 2016-17 resulted in a deficit accumulation of $87.1 billion.
The sum of deficits plus interest becomes the provincial public debt and Figure 3 plots Ontario’s net debt (gross debt minus financial assets) as well as its debt to GDP ratio. Net debt in 1980-81 was $12 billion and this grew to reach $302 billion by 2016-17 and is forecast to reach $360 billion by 2020-21. In terms of the debt to GDP ratio, it has grown from 9.1 percent in 1980-81 to just under 40 percent presently. These increases in debt have occurred in three waves each triggered by a major recession during which revenues fell or grew more slowly and expenditures rose dramatically – with the trigger periods being the recessions of 1980-81, 1990-91 and 2008-09 as well illustrated by the performance of the net debt to GDP ratio in Figure 3.

Prior to the 1980-81 recession, the debt-to-GDP ratio was just under 10 percent and it rose to 13 percent by 1990-91. It then grew to almost 30 percent by the late 1990s and then declined slightly until resuming its increase after 2008-09 from 28 percent to reach 37 percent at present.
Another way of viewing Ontario’s debt is as follows: the current net debt is the sum of all deficits plus interest and other capital borrowing since Ontario became a province in 1867. Ontario’s net debt in 1990-91 was $38.4 billion and in 2016-17 it was $301.6 billion. This means that about 13 percent of Ontario’s current net debt was accumulated from 1867 to 1990 and the remainder – 87 percent has all been added since 1990. It should be noted that this debt was accumulated irrespective of the political leanings of the day as over the period 1990 to 2017 all three Ontario parties have held office at some point.
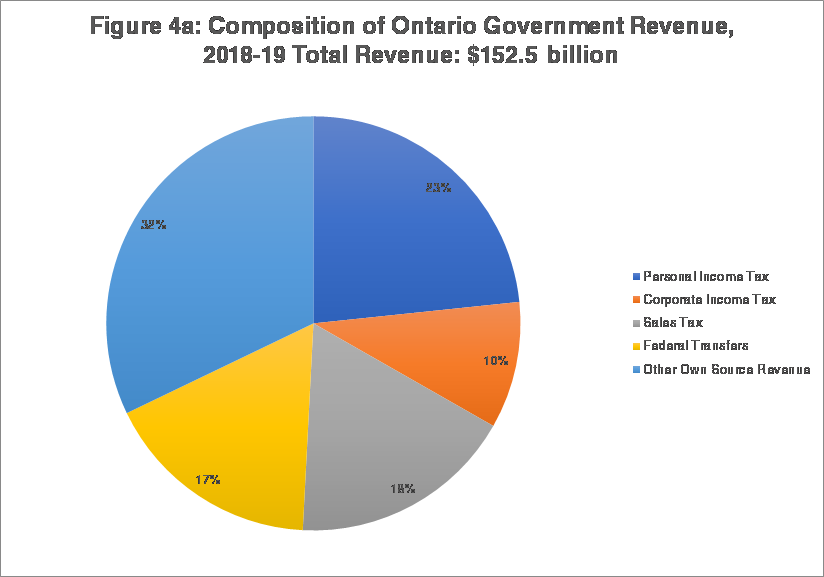
The present composition of Ontario government revenues and spending is detailed in Figures 4a and 4b as set out in the 2018 Ontario Budget. Income taxation – personal and corporate – together account for 33 percent of Ontario government revenue with sales taxation making up another 18 percent. Federal transfers account for another 17 percent and the remaining 32 percent is composed of other own source revenues.[2]
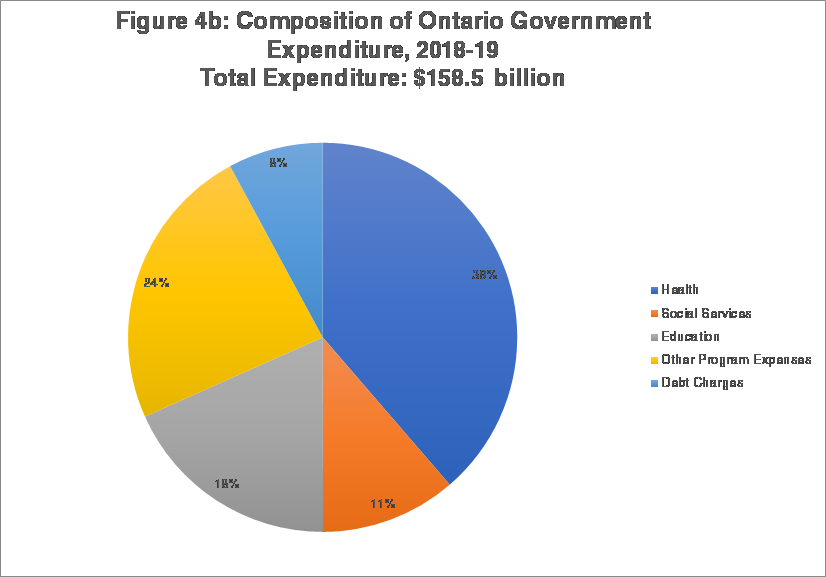
As for spending, the largest portion at 39 percent of total expenditure is for health care, followed by education (primary and secondary) at 18 percent. Social services account for 11 percent, debt charges for 8 percent and the remaining 24 percent is other program spending including items such as such as post-secondary education and training, justice and transportation.
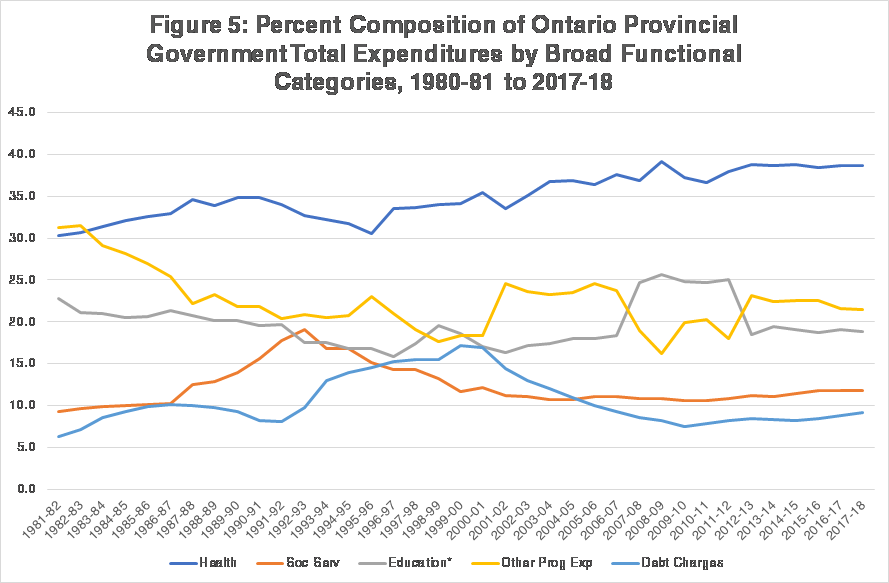
The long-term evolution of spending is important and documented in Figure 5.[3] Health spending, social services and debt charges have been the fastest growing portions of the provincial budget over time and their share of the provincial budget has increased. Over the period 1980-81 to 2016-17, the health share of total expenditures rose from 30 to 39 percent while social services went from 9 to 12 percent and debt charges from 7 to 9 percent. It should be noted that while social services is up overall, its current share is a decline from a peak reached in the early 1990s.
Meanwhile, the share of education[4] and other program expenditures has gradually declined over this period. It should also be noted that the recent closing of the budgetary gap in Ontario culminating in a surplus for 2017-18 is partly a function of rising revenues due to an improving economy but also there has been some restraint in program expenditure growth. Since 2012-13, total program spending increases in general and health spending increases in particular have averaged close to 3 percent – well below the historical average though this has changed in the 2018 Budget. The 2018 Budget has health and education spending through to 2020-21 growing at just over 4 percent annually.[5]
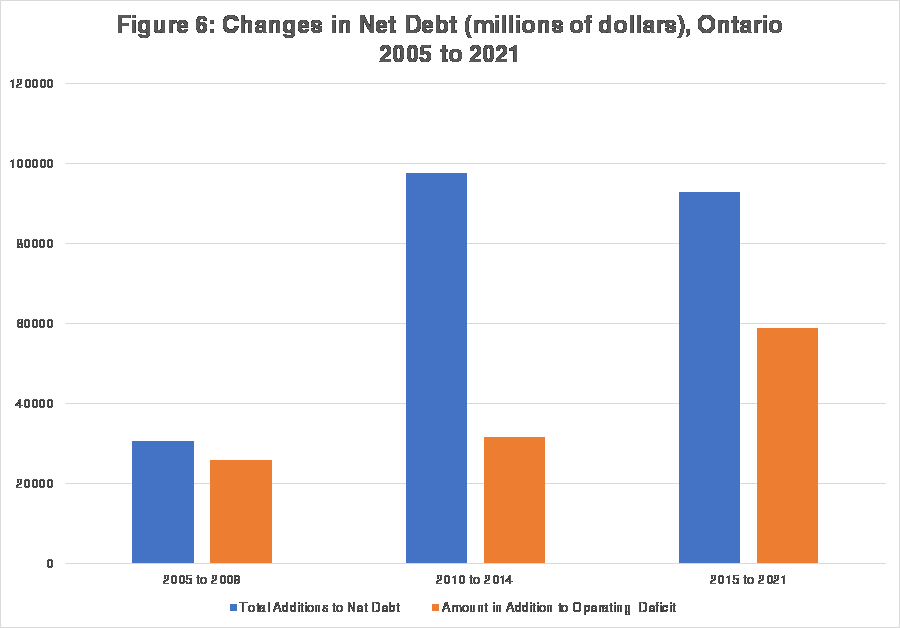
What is a curious feature of recent years however, is even with the declining deficits in the period up to the 2018 Budget, Ontario’s net debt grew substantially and is projected to continue rising. Over the period 2004-05 to 2020-21, accumulated deficits are estimated at $104.7 billion but the total addition to the Ontario government net public debt is $221.3 billion – there is an addition to the net debt in excess of the accumulated deficits to the amount of $116.6 billion. While some of this may be due to interest service costs, that represents only a small portion of the difference given that interest rates and debt service costs have been at historical lows for over a decade.
The difference is due to a change in government accounting practices whereby borrowing for new capital spending is now being added to the debt independently of program spending. Provincial governments – including Ontario – are using “capital budgeting” techniques whereby infrastructure expenditures are not charged against the operating budget but capital depreciation or the user cost of capital is treated as an expense in the spending of the applicable government ministry.[6] In many respects, this is a fiscal device whereby a provincial government is able to present balanced budgets or even small operating surpluses while still adding to the debt which in the long run will raise debt service costs and erode the small operating surplus.[7]
For example, in fiscal year 2014-15, Ontario’s budgetary deficit was $10.3 billion but the net debt rose by $17.4 billion. In 2015-16, the deficit was $3.5 billion but $10.8 billion was added to the net debt. In 2016-17, the deficit was $0.9 billion but $6.3 was added to the net debt. As Figure 6 shows, this practice as a proportion of total net debt increases is expected to increase for the period 2015 to 2020 when budget projections are considered. While much of the debt accumulation has been due to operating deficits, it would appear that in future, capital spending will become the larger debt contributor.
The Ontario government has committed to spending more than $190 billion in public infrastructure over 13 years starting in 2014–15, for priority projects such as roads, bridges, public transit, hospitals and schools. This represents an increase of $30 billion from the 12‐year plan that was announced in the 2016 Budget as the result of investments, such as new hospital projects, school renewal initiatives and child care expansion.[8] This infrastructure spending was $11 billion in 2014-15, $11 billion in 2015-16, $12 billion for 2016-17 and for 2017-18 to 2026-27 expected to total $156 billion.[9] As a result, even with balanced budgets until 2026-27, Ontario can be expected to add at least another $156 billion to its net debt bringing it close to $500 billion dollars by 2026-27. This can be expected to add substantially to provincial government debt charges even should interest rates remain at historic lows.
Challenges to Ontario’s Public Finances
Ontario faces a number of challenges to its fiscal situation.[10] Meeting the current needs of a growing, aging and diverse population with limited resources in a competitive global economic environment combined with the need to renew aging provincial capital infrastructure poses an number of challenges to the long-term sustainability of Ontario’s finances. Specific factors include an aging population and rising demands for health care and long-term care, economic uncertainty given NAFTA and international trade considerations and the potential short-term revenue impacts, rising interest rates given the Bank of Canada appears to have embarked on a series of increases, and the need to continue investing in human and social capital. Moreover, the provincial government appears to have embarked on an enrichment of spending that includes more spending on social initiatives as well as health and long-term care and its Fair Hydro Plan which involves lowering electricity bills for residential and business customers.
Indeed, both the province’s Auditor General as well as the Financial Accountability Office (FAO) have authored reports on the province’s fiscal challenges and sustainability issues. Along with the usual concerns of value for money audits with respect to service delivery and program implementation, the Auditor General’s 2017 report[11] particularly noted its concerns with certain government accounting plans including its approach to financing and accounting for the costs of its electricity rate reduction policy – the Fair Hydro Plan – as well as reservations with the provincial government approach to claiming Ontario Teacher Pension Plan assets.[12] Most recently, the Office of the Auditor-General’s audit of the Independent Electricity Operator (IESO) informed the provincial public accounts committee of concerns regarding accounting practices which if not corrected might result in the office issuing an adverse opinion on Ontario’s public accounts.[13]
The FAO in a recent commentary noted that the provincial government’s spending plans and balanced budget forecasts beginning in 2017-18 relies on optimistic revenue forecasts whereas there is a significant risk that additional fiscal policy measures will be needed. Specifically, the 2017 Budget forecasted tax revenue growth of 5.5 per cent per year on average from 2016-17 to 2019-20 – significantly above the historical pace of 3.3 per cent since 2004-05[14]
The FAO’s Fall 2017 Update to the Economic and Fiscal Outlook has noted that despite a strong boost to revenues as a result of an improving economy the prospect for future deficits was high as a result “of the Auditor General of Ontario’s recommended accounting treatment for both the government’s Fair Hydro Plan and the net pension assets of jointly-sponsored pension plans.”[15]
By 2021-22, the FAO projects a budget deficit of $9.8 billion, primarily because of the introduction of the Fair Hydro Plan, which will add $3.2 billion to the budget deficit under the Auditor General’s recommended accounting treatment (whereas if the government accounting framework is used, there will be a small surplus in 2017-18 followed by a return to deficits beginning 2018-19. It should be noted that for 2021-22, the 2018 Budget projects a deficit of $5.6 billion.
While Ontario has been seeking to restrain growth in its largest expenditure item – health care [16]– the FAO noted in another report that for the province to continue to meet its budget targets, the Province would need to implement additional program changes in health sector expense savings of $0.9 billion in 2017-18 and $1.5 billion in 2018-19. However, according to the FAO this in turn would raise questions about the maintenance of health care quality and service levels. Despite maintaining health sector spending growth between 2 and 3 percent, the FAO estimates that health sector expense cost drivers (population growth and aging, inflation and income growth) will lead to health sector expense growth rate pressures of 5.3% per year to 2020.[17] Needless to say, the FAO has also projected that that Ontario’s net debt will increase by $76 billion over the next five years to approximately $392 billion in 2021-22, resulting in the net debt-to-GDP ratio growing to 40.3 per cent. This differs from the 2017 budget, in which the province projected a small decline in the net debt-GDP ratio to 36.3 per cent by 2021-22[18] or the 2018 budget which projects a net debt in 2020-21 of $360.1 billion and a net debt to GDP ratio of 38.6 percent.
Over the longer term, the federal Parliamentary Budget Office (PBO) has also noted the fiscal challenges affecting the long-term sustainability of Ontario’s public finances.[19] Key points include a slowdown in population growth with a projected rise in the senior dependency ratio projected to rise from 24.2 percent in 2016 to 40.9 per cent by 2040.[20] The PBO projects that real GDP growth in Ontario will slow from 2.0 per cent annually, on average, over 2017 to 2022 to 1.6 per cent annually, on average, over the long term. As a result, the PBO forecasts that current fiscal policy in Ontario is not sustainable over the long term and estimates that permanent tax increases or spending reductions amounting to 0.4 per cent of provincial GDP ($3.5 billion in current dollars) would be required to achieve fiscal sustainability. Health care spending is the key fiscal pressure in their projection, increasing by 2.6 percentage points of GDP over 2020 to 2091.
Concluding Recommendations for Change:
A Five Point Strategy
The public goods and services provided by government in the areas of health, education, social services and infrastructure are vital to the operation of a 21st century economy and the social welfare of its population but they are jeopardized if public finances are not sustainable. If governments truly want to help people, they need to ensure that they deliver consistently and responsibly funded needed public services that do not place an undue burden on the tax base and ultimately taxpayers. Running deficits and continually adding to the provincial debt over the long-term does not take the best interests of Ontarians into as large public debts ultimately will generate debt service costs that may actually reduce the operating funds available for vital public services. There are a number of measures that Ontario’s provincial government could adopt in an effort to address the sustainability of the public finances over the medium-term.
1. Expenditure Growth Target 2+1 (2% inflation, 1% population)
Aside from the relative restraint of the last few years, the historical long-term Ontario provincial government expenditure growth rate since 1981 has been approximately 6 percent. The nominal GDP growth rate over the same period has been approximately 5 percent. Sustainability of government expenditures over the long-term is assisted by ensuring that expenditures growth does not exceed the growth of the resource base. The specific resource base is of course government revenue, but the province’s output is the general base from which those revenues come from. By setting an annual expenditure target growth rate equal to the annual rate of inflation (currently 2 percent) plus the rate of population growth of approximately 1 percent, expenditure sustainability will be assured by having expenditure growth well below historical revenue growth of just over 6 percent as well as GDP growth of 5 percent. Keeping expenditure growth at 3 percent annually also affords the opportunity for the development of a more competitive tax structure for the province over the long term given that fiscal room will be generated as surpluses are applied to reducing the debt thereby reducing debt service costs.
In terms of the savings that such a growth rule might be expected to generate, much depends on what you believe provincial government spending will be in the absence of such a growth rule. For example, according to the provincial government’s fall fiscal update,[21] the average annual growth rate of total provincial government spending from 2017-18 to 2020-21 would be 3.6 percent. The difference between the provincial forecast for their expenditures and 3 percent growth would generate by 2021-21 total additional expenditure of $3.6 billion. However, if one were to use the expenditure forecasts of the Financial Accountability Office from December 2017[22] – which result in average annual total expenditure growth of 4.4 percent from 2017-18 to 2020-21 – then the total savings between what their expenditure projection and a 3 percent growth rule would total $26.5 billion.[23]
The 2018 Budget affords another opportunity for comparison. Figure 7 (see next page) compares provincial government expenditures using a 3-percent annual growth rule to what is projected in the Ontario budget for the period from 2017-18 to 2024-25. By 2024-25, the 2018 Budget projection has government expenditures at $186.5 billion while the 3-Percent Rule would have expenditures at $183.9 billion. This appears to be a small difference but is the result of the large increases early on in Ontario government spending of 6.5 percent in 2018-19 and then a fall in the growth rate to 3.2 percent in 2019-20 and 3.7 percent in
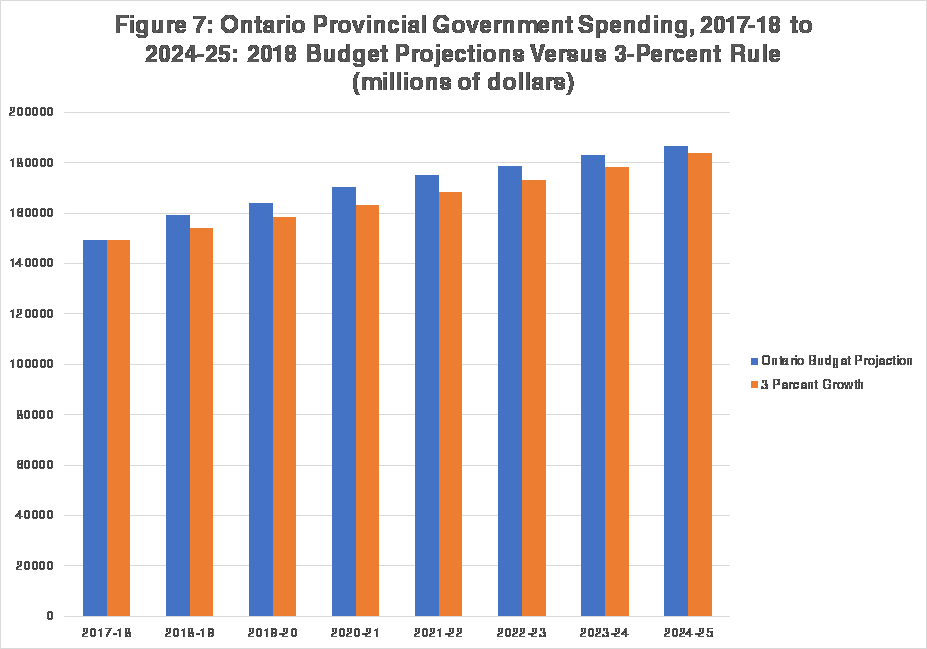
2020-21.[24] However, when one sums the differences over this seven-year time period, the total savings from following the 3-Percent Rule compared to the Ontario budget projections is actually $37.2 billion. This especially illustrates the importance of having expenditures grow at an annual rate of 3 percent rather than an average of 3 percent over the same period of time.
2. Expenditure Review
The provincial government in a manner similar to the Drummond Report of 2012[25] should undertake a comprehensive review of what it does with the aim to enact transformative change and efficiencies and restructure public spending. Key sectors that should be revisited include health, education, and social services as well capital project financing and business subsidies and assistance to the corporate sector. In particular, Ontario needs to avoid public policy inconsistency when it comes to business subsidies. As an example, on the one hand, Ontario has forced a transition to more expensive power sources as part of a strategy of environmental sustainability, and then on the other hand continues to subsidize automobile manufacturing.[26] More of an effort needs to be made to eliminate these policy inconsistencies when it comes to government expenditures if sustainable public finances are to be achieved. If the provincial government is looking for more explicit guidance in an expenditure review, then one model worth following would be the program review initiated by the Federal government in response to the federal fiscal crisis of the early 1990s. This review was introduced in the 1994 federal budget and was applied to all departmental spending.[27] The result was a 9.7 percent drop in program spending from 1994-95 to 1996-97 and a return to budget surpluses in 1997-98 after 27 years of consecutive federal deficits.[28]
3. Surplus disposition: 1+1+1 (1$ debt reduction; 1$ tax reduction, 1$ new spending)
If surpluses are to be generated, it is important that there be a responsible plan to use the fiscal room that is created by said surpluses. A positive fiscal situation will inevitably generate a loud public chorus demanding new “investments” and spending. As a result, there should be a disciplined plan to make sure that not all of a future surplus is eaten up by new initiatives. A prudent strategy would be to earmark the fiscal dividend from future surpluses three ways: one-third should go to paying down the public debt; one-third should go to reducing the tax burden in an effort to stimulate new economic activity and one-third earmarked to finance new initiatives.
4. New Independent Capital Expenditure Review Process
In our haste to renew provincial capital infrastructure and stimulate the economy, we run the risk of wasting tax dollars if we build poorly designed or unnecessary infrastructure as well as bid up the cost of building. Key to any infrastructure building is the need to develop a list of priorities as well as choose the projects that can generate the highest rate of return. Establishing an independent project review panel consisting of an arms-length expert panel (accountants, economists, engineers, business people) to do economic evaluations as to whether a project is needed or not would be a good step in the direction of more responsible provincial fiscal management and reduce the impact of political pressure on which projects are selected. Such a panel could also suggest cost effective ways to implement projects that are deemed necessary.
5. Sinking funds for new debt to finance capital infrastructure
If the provincial government is to continue its current approach of separating capital from operating budgets, then it needs to account for more than the user cost of capital when calculating the deficit and also make provisions for paying back an annual portion of the capital project principal borrowing via a sinking fund approach. The sinking fund is an older public finance concept that may be of use here. Until the early twentieth century, Canadian and American governments often made use of sinking funds that required them to also pay back principal on their debt.
Sinking funds are: “devices to ensure creditors that the securities they purchased would be redeemed by contractual commitments, sometimes according to schedules established either at the time the securities were issued or soon thereafter. For most if its history, the US government debt was in fact subject to legislatively established sinking-fund provisions. Although sinking funds remain important in modern corporate finance, starting in the 1930s they slipped into the background and then disappeared from US government debt policies.”[29]
The Ontario government can more accurately take into account the costs of its capital budget borrowing via a sinking fund approach. Whenever debt to fund capital projects is issued, the commitment should be made to make payments on the principal over a 20 to 30-year period with those payments recorded as part of operating expenditure. For example, for the $12 billion dollars in infrastructure spending borrowed for in 2016-17, assuming a 25-year sinking fund, there would be 480 million dollars a year added to operating budgets over the next 25 budget years to pay down the amount borrowed.
Livio Di Matteo is a Professor of Economics at Lakehead University in Thunder Bay, Ontario, and Senior Fellow at the Fraser Institute. He specializes in public policy, health economics, public finance, and economic history.
References
Clemens, J., M. Palacios, M. Lau and N. Veldhuis (2017) End of the Chretien Consensus? Fraser Institute.
Di Matteo, L. (2017) A Federal Fiscal History: Canada, 1867-2017. Fraser Institute.
Government of Canada, Department of Finance (2017) Federal Fiscal Reference Tables 2017.
Financial Accountability Office of Ontario (2017) Economic and Fiscal Outlook: Assessing Ontario’s Medium-term Prospects. Fall 2017 Update.
Financial Accountability Office of Ontario (2017) Ontario Health Sector: Expense Trends and Medium-Term Outlook Analysis. Winter 2017.
Financial Accountability Office of Ontario (2017) FAO Commentary: Optimistic Revenue Projection Underpins Government’s Balanced Budget Plan August 2017.
Financial Accountability Office of Ontario (2017) FAO Commentary: Ontario’s Debt Reduction Commitment Based on Unlikely Assumptions. September 6.
Kneebone, R. and M. Wilkins (2016) “Canadian Provincial Government Budget Data, 1980/81 to 2013/14” Canadian Public Policy, March, 42,1,1-19.
McClearn, Matthew (2018). “Auditor-General blasts ‘bogus’ hydro accounting strategies in Ontario, Globe and Mail. March 25.
Office of the Auditor General of Ontario (2017) Annual Report 2017. Vol. 1 & 2. Toronto.
Office of the Parliamentary Budget Officer (2017) Fiscal Sustainability Report 2017. Ottawa.
Ontario (2017) A Strong and Fair Ontario: 2017 Ontario Economic Outlook and Fiscal Review.
Ontario (2017) 2017 Ontario Budget: A Stronger, Healthier Ontario.
Ontario (2018) 2018 Ontario Budget: A Plan for Care and Opportunity.
Mintz, J. (2015) “Provinces play ‘hide the deficits’. Financial Post. March 12.
Sylla, R., and J.W. Wilson (1999). Sinking Funds as Credible Commitments: Two
Centuries of Us National-Debt Experience. Japan and the World Economy 11: 199–222.
Wen, J.F. (2015) Ontario’s Debt Balloon: Source and sustainability. Fraser Institute.